
Page 231 - Demo
P. 231
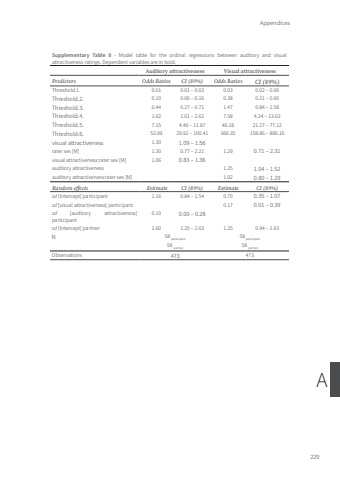
Appendices229ASupplementary Table 8 - Model table for the ordinal regressions between auditory and visual attractiveness ratings. Dependent variables are in bold.Auditory attractiveness Visual attractivenessPredictors Odds Ratios CI (89%) Odds Ratios CI (89%)Threshold.1. 0.01 0.01 – 0.03 0.03 0.02 – 0.06Threshold.2. 0.10 0.06 – 0.16 0.38 0.21 – 0.66Threshold.3. 0.44 0.27 – 0.71 1.47 0.84 – 2.58Threshold.4. 1.62 1.01 – 2.62 7.58 4.24 – 13.63Threshold.5. 7.15 4.40 – 11.87 40.18 21.27 – 77.12Threshold.6. 53.99 29.92 – 100.41 360.35 158.86 – 896.16visual attractiveness 1.30 1.09 – 1.56rater sex [M] 1.30 0.77 – 2.21 1.29 0.71 – 2.31visual attractiveness:rater sex [M] 1.06 0.83 – 1.36auditory attractiveness 1.25 1.04 – 1.52auditory attractiveness:rater sex [M] 1.02 0.80 – 1.29Random effects Estimate CI (89%) Estimate CI (89%)sd [Intercept] participant 1.16 0.84 – 1.54 0.70 0.35 – 1.07sd [visual attractiveness] participant 0.17 0.01 – 0.39sd [auditory attractiveness] participant0.10 0.00 – 0.28sd [Intercept] partner 1.60 1.25 – 2.03 1.25 0.94 – 1.63N 58 participant 58 participant58 partner 58 partnerObservations 473 473Tom Roth.indd 229 08-01-2024 10:42
