
Page 227 - Demo
P. 227
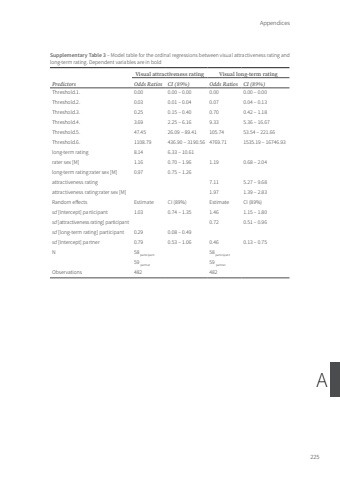
Appendices225ASupplementary Table 3 – Model table for the ordinal regressions between visual attractiveness rating and long-term rating. Dependent variables are in boldPredictorsVisual attractiveness rating Visual long-term ratingOdds Ratios CI (89%) Odds Ratios CI (89%)Threshold.1. 0.00 0.00 – 0.00 0.00 0.00 – 0.00Threshold.2. 0.03 0.01 – 0.04 0.07 0.04 – 0.13Threshold.3. 0.25 0.15 – 0.40 0.70 0.42 – 1.18Threshold.4. 3.69 2.25 – 6.16 9.33 5.36 – 16.67Threshold.5. 47.45 26.09 – 89.41 105.74 53.54 – 221.66Threshold.6. 1108.79 436.90 – 3190.56 4769.71 1535.19 – 16746.93long-term rating 8.14 6.33 – 10.61rater sex [M] 1.16 0.70 – 1.96 1.19 0.68 – 2.04long-term rating:rater sex [M] 0.97 0.75 – 1.26attractiveness rating 7.11 5.27 – 9.68attractiveness rating:rater sex [M] 1.97 1.39 – 2.83Random effects Estimate CI (89%) Estimate CI (89%)sd [Intercept] participant 1.03 0.74 – 1.35 1.46 1.15 – 1.80sd [attractiveness rating] participant 0.72 0.51 – 0.96sd [long-term rating] participant 0.29 0.08 – 0.49sd [Intercept] partner 0.79 0.53 – 1.06 0.46 0.13 – 0.75N 58 participant 58 participant59 partner 59 partnerObservations 482 482Tom Roth.indd 225 08-01-2024 10:42
