
Page 232 - Demo
P. 232
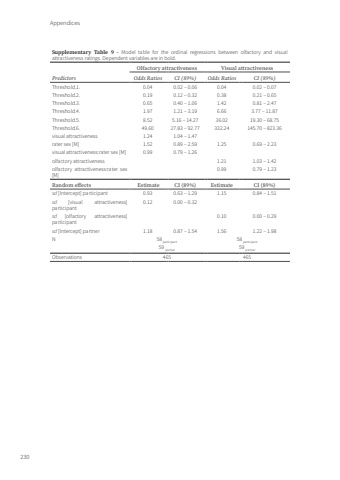
Appendices230Supplementary Table 9 - Model table for the ordinal regressions between olfactory and visual attractiveness ratings. Dependent variables are in bold.PredictorsOlfactory attractiveness Visual attractivenessOdds Ratios CI (89%) Odds Ratios CI (89%)Threshold.1. 0.04 0.02 – 0.06 0.04 0.02 – 0.07Threshold.2. 0.19 0.12 – 0.32 0.38 0.21 – 0.65Threshold.3. 0.65 0.40 – 1.06 1.42 0.81 – 2.47Threshold.4. 1.97 1.21 – 3.19 6.66 3.77 – 11.87Threshold.5. 8.52 5.16 – 14.27 36.02 19.30 – 68.75Threshold.6. 49.60 27.83 – 92.77 332.24 145.70 – 823.36visual attractiveness 1.24 1.04 – 1.47rater sex [M] 1.52 0.89 – 2.59 1.25 0.69 – 2.23visual attractiveness:rater sex [M] 0.99 0.79 – 1.26olfactory attractiveness 1.21 1.03 – 1.42olfactory attractiveness:rater sex [M]0.99 0.79 – 1.23Random effects Estimate CI (89%) Estimate CI (89%)sd [Intercept] participant 0.93 0.63 – 1.29 1.15 0.84 – 1.51sd [visual attractiveness] participant0.12 0.00 – 0.32sd [olfactory attractiveness] participant0.10 0.00 – 0.29sd [Intercept] partner 1.18 0.87 – 1.54 1.56 1.22 – 1.98N 58 participant 58 participant59 partner 59 partnerObservations 465 465Tom Roth.indd 230 08-01-2024 10:42
