
Page 228 - Demo
P. 228
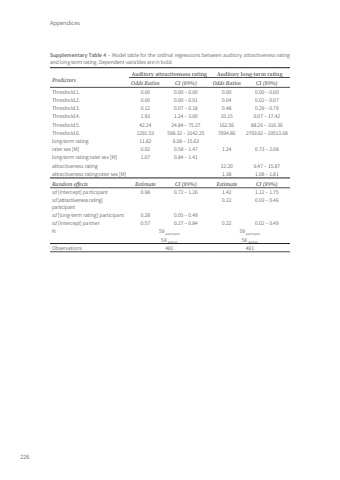
Appendices226Supplementary Table 4 – Model table for the ordinal regressions between auditory attractiveness rating and long-term rating. Dependent variables are in bold.PredictorsAuditory attractiveness rating Auditory long-term ratingOdds Ratios CI (89%) Odds Ratios CI (89%)Threshold.1. 0.00 0.00 – 0.00 0.00 0.00 – 0.00Threshold.2. 0.00 0.00 – 0.01 0.04 0.02 – 0.07Threshold.3. 0.12 0.07 – 0.18 0.48 0.29 – 0.79Threshold.4. 1.93 1.24 – 3.00 10.15 6.07 – 17.42Threshold.5. 42.24 24.84 – 75.27 162.56 88.26 – 316.36Threshold.6. 1291.53 598.32 – 3142.25 7094.86 2793.92 – 19513.68long-term rating 11.82 9.08 – 15.63rater sex [M] 0.92 0.58 – 1.47 1.24 0.73 – 2.08long-term rating:rater sex [M] 1.07 0.84 – 1.41attractiveness rating 12.20 9.47 – 15.87attractiveness rating:rater sex [M] 1.38 1.08 – 1.81Random effects Estimate CI (89%) Estimate CI (89%)sd [Intercept] participant 0.98 0.72 – 1.26 1.42 1.12 – 1.75sd [attractiveness rating] participant0.22 0.03 – 0.46sd [long-term rating] participant 0.28 0.05 – 0.49sd [Intercept] partner 0.57 0.27 – 0.84 0.22 0.02 – 0.49N 59 participant 59 participant58 partner 58 partnerObservations 481 481Tom Roth.indd 226 08-01-2024 10:42
