
Page 233 - Demo
P. 233
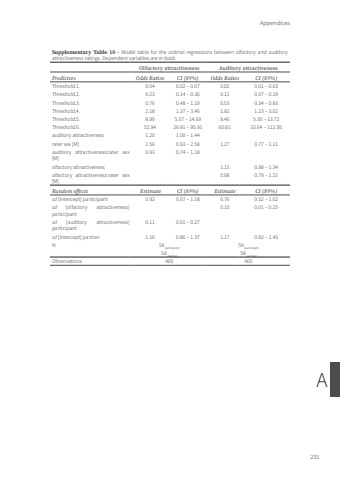
Appendices231ASupplementary Table 10 - Model table for the ordinal regressions between olfactory and auditory attractiveness ratings. Dependent variables are in bold.Olfactory attractiveness Auditory attractivenessPredictors Odds Ratios CI (89%) Odds Ratios CI (89%)Threshold.1. 0.04 0.02 – 0.07 0.02 0.01 – 0.03Threshold.2. 0.23 0.14 – 0.36 0.12 0.07 – 0.19Threshold.3. 0.76 0.48 – 1.19 0.53 0.34 – 0.83Threshold.4. 2.18 1.37 – 3.46 1.92 1.23 – 3.02Threshold.5. 8.99 5.57 – 14.69 8.46 5.30 – 13.72Threshold.6. 52.94 29.91 – 95.91 60.81 33.64 – 112.95auditory attractiveness 1.20 1.00 – 1.44rater sex [M] 1.56 0.93 – 2.58 1.27 0.77 – 2.11auditory attractiveness:rater sex [M]0.93 0.74 – 1.18olfactory attractiveness 1.15 0.98 – 1.34olfactory attractiveness:rater sex [M]0.98 0.79 – 1.21Random effects Estimate CI (89%) Estimate CI (89%)sd [Intercept] participant 0.92 0.67 – 1.18 0.76 0.52 – 1.02sd [olfactory attractiveness] participant0.10 0.01 – 0.25sd [auditory attractiveness] participant0.11 0.01 – 0.27sd [Intercept] partner 1.10 0.86 – 1.37 1.17 0.92 – 1.45N 59 participant 59 participant58 partner 58 partnerObservations 465 465Tom Roth.indd 231 08-01-2024 10:42
