
Page 229 - Demo
P. 229
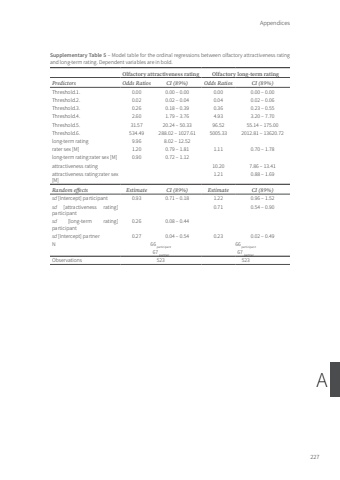
Appendices227ASupplementary Table 5 – Model table for the ordinal regressions between olfactory attractiveness rating and long-term rating. Dependent variables are in bold.Olfactory attractiveness rating Olfactory long-term ratingPredictors Odds Ratios CI (89%) Odds Ratios CI (89%)Threshold.1. 0.00 0.00 – 0.00 0.00 0.00 – 0.00Threshold.2. 0.02 0.02 – 0.04 0.04 0.02 – 0.06Threshold.3. 0.26 0.18 – 0.39 0.36 0.23 – 0.55Threshold.4. 2.60 1.79 – 3.76 4.93 3.20 – 7.70Threshold.5. 31.57 20.24 – 50.33 96.52 55.14 – 175.00Threshold.6. 534.49 288.02 – 1027.61 5005.33 2012.81 – 13620.72long-term rating 9.96 8.02 – 12.52rater sex [M] 1.20 0.79 – 1.81 1.11 0.70 – 1.78long-term rating:rater sex [M] 0.90 0.72 – 1.12attractiveness rating 10.20 7.86 – 13.41attractiveness rating:rater sex [M]1.21 0.88 – 1.69Random effects Estimate CI (89%) Estimate CI (89%)sd [Intercept] participant 0.93 0.71 – 0.18 1.22 0.96 – 1.52sd [attractiveness rating] participant0.71 0.54 – 0.90sd [long-term rating] participant0.26 0.08 – 0.44sd [Intercept] partner 0.27 0.04 – 0.54 0.23 0.02 – 0.49N 66 participant 66 participant67 partner 67 partnerObservations 523 523Tom Roth.indd 227 08-01-2024 10:42
