
Page 30 - Demo
P. 30
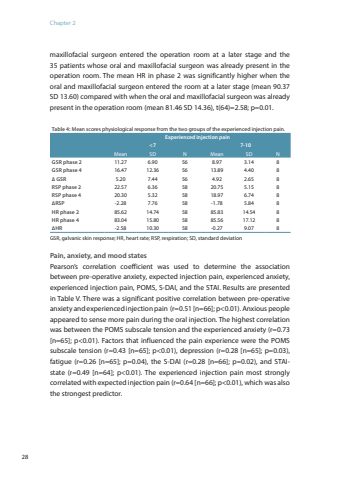
Chapter 228maxillofacial surgeon entered the operation room at a later stage and the 35 patients whose oral and maxillofacial surgeon was already present in the operation room. The mean HR in phase 2 was significantly higher when the oral and maxillofacial surgeon entered the room at a later stage (mean 90.37 SD 13.60) compared with when the oral and maxillofacial surgeon was already present in the operation room (mean 81.46 SD 14.36), t(64)=2.58; p=0.01. Table 4: Mean scores physiological response from the two groups of the experienced injection pain.Experienced injection pain<7 7-10Mean SD N Mean SD NGSR phase 2GSR phase 4∆ GSR11.2716.475.206.9012.367.445656568.9713.894.923.144.402.65888RSP phase 2RSP phase 4∆RSP22.5720.30-2.286.365.327.7658585820.7518.97-1.785.156.745.84888HR phase 2HR phase 4∆HR85.6283.04-2.5814.7415.8010.3058585885.8385.56-0.2714.5417.129.07888GSR, galvanic skin response; HR, heart rate; RSP, respiration; SD, standard deviationPain, anxiety, and mood statesPearson’s correlation coefficient was used to determine the association between pre-operative anxiety, expected injection pain, experienced anxiety, experienced injection pain, POMS, S-DAI, and the STAI. Results are presented in Table V. There was a significant positive correlation between pre-operative anxiety and experienced injection pain (r=0.51 [n=66]; p<0.01). Anxious people appeared to sense more pain during the oral injection. The highest correlation was between the POMS subscale tension and the experienced anxiety (r=0.73 [n=65]; p<0.01). Factors that influenced the pain experience were the POMS subscale tension (r=0.43 [n=65]; p<0.01), depression (r=0.28 [n=65]; p=0.03), fatigue (r=0.26 [n=65]; p=0.04), the S-DAI (r=0.28 [n=66]; p=0.02), and STAIstate (r=0.49 [n=64]; p<0.01). The experienced injection pain most strongly correlated with expected injection pain (r=0.64 [n=66]; p<0.01), which was also the strongest predictor.
