
Page 29 - Demo
P. 29
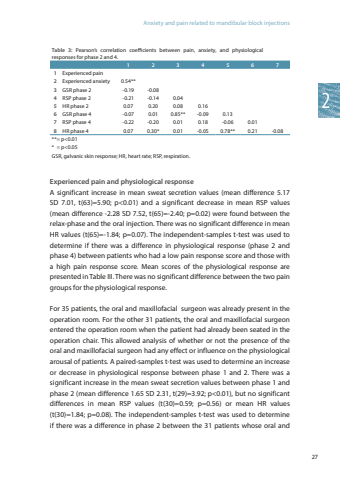
Anxiety and pain related to mandibular block injections272Table 3: Pearson’s correlation coefficients between pain, anxiety, and physiological responses for phase 2 and 4.1 2 3 4 5 6 71 Experienced pain2 Experienced anxiety 0.54**3 GSR phase 2 -0.19 -0.084 RSP phase 2 -0.21 -0.14 0.045 HR phase 2 0.07 0.20 0.08 0.166 GSR phase 4 -0.07 0.01 0.85** -0.09 0.137 RSP phase 4 -0.22 -0.20 0.01 0.18 -0.06 0.018 HR phase 4 0.07 0.30* 0.01 -0.05 0.78** 0.21 -0.08**= p<0.01* = p<0.05GSR, galvanic skin response; HR, heart rate; RSP, respiration.Experienced pain and physiological responseA significant increase in mean sweat secretion values (mean difference 5.17 SD 7.01, t(63)=5.90; p<0.01) and a significant decrease in mean RSP values (mean difference -2.28 SD 7.52, t(65)=-2.40; p=0.02) were found between the relax-phase and the oral injection. There was no significant difference in mean HR values (t(65)=-1.84; p=0.07). The independent-samples t-test was used to determine if there was a difference in physiological response (phase 2 and phase 4) between patients who had a low pain response score and those with a high pain response score. Mean scores of the physiological response are presented in Table III. There was no significant difference between the two pain groups for the physiological response. For 35 patients, the oral and maxillofacial surgeon was already present in the operation room. For the other 31 patients, the oral and maxillofacial surgeon entered the operation room when the patient had already been seated in the operation chair. This allowed analysis of whether or not the presence of the oral and maxillofacial surgeon had any effect or influence on the physiological arousal of patients. A paired-samples t-test was used to determine an increase or decrease in physiological response between phase 1 and 2. There was a significant increase in the mean sweat secretion values between phase 1 and phase 2 (mean difference 1.65 SD 2.31, t(29)=3.92; p<0.01), but no significant differences in mean RSP values (t(30)=0.59; p=0.56) or mean HR values (t(30)=1.84; p=0.08). The independent-samples t-test was used to determine if there was a difference in phase 2 between the 31 patients whose oral and
