
Page 68 - Demo
P. 68
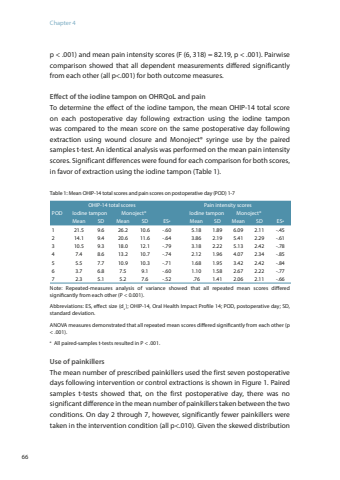
Chapter 466p < .001) and mean pain intensity scores (F (6, 318) = 82.19, p < .001). Pairwise comparison showed that all dependent measurements differed significantly from each other (all p<.001) for both outcome measures. Effect of the iodine tampon on OHRQoL and painTo determine the effect of the iodine tampon, the mean OHIP-14 total score on each postoperative day following extraction using the iodine tampon was compared to the mean score on the same postoperative day following extraction using wound closure and Monoject® syringe use by the paired samples t-test. An identical analysis was performed on the mean pain intensity scores. Significant differences were found for each comparison for both scores, in favor of extraction using the iodine tampon (Table 1).Table 1: Mean OHIP-14 total scores and pain scores on postoperative day (POD) 1-7OHIP-14 total scores Pain intensity scoresPOD Iodine tampon Monoject® Iodine tampon Monoject®Mean SD Mean SD ESa Mean SD Mean SD ESa1 21.5 9.6 26.2 10.6 -.60 5.18 1.89 6.09 2.11 -.452 14.1 9.4 20.6 11.6 -.64 3.86 2.19 5.41 2.29 -.613 10.5 9.3 18.0 12.1 -.79 3.18 2.22 5.13 2.42 -.784 7.4 8.6 13.2 10.7 -.74 2.12 1.96 4.07 2.34 -.855 5.5 7.7 10.9 10.3 -.71 1.68 1.95 3.42 2.42 -.846 3.7 6.8 7.5 9.1 -.60 1.10 1.58 2.67 2.22 -.777 2.3 5.1 5.2 7.6 -.52 .76 1.41 2.06 2.11 -.66Note: Repeated-measures analysis of variance showed that all repeated mean scores differed significantly from each other (P < 0.001).Abbreviations: ES, effect size (ds ); OHIP-14, Oral Health Impact Profile 14; POD, postoperative day; SD, standard deviation.ANOVA measures demonstrated that all repeated mean scores differed significantly from each other (p < .001). a All paired-samples t-tests resulted in P < .001.Use of painkillersThe mean number of prescribed painkillers used the first seven postoperative days following intervention or control extractions is shown in Figure 1. Paired samples t-tests showed that, on the first postoperative day, there was no significant difference in the mean number of painkillers taken between the two conditions. On day 2 through 7, however, significantly fewer painkillers were taken in the intervention condition (all p<.010). Given the skewed distribution
