
Page 62 - Demo
P. 62
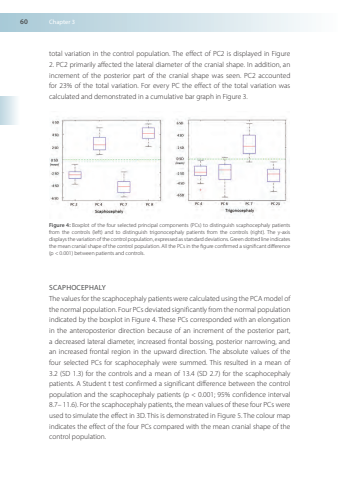
60Chapter3totalvariationinthecontrolpopulationTheeffectofPC2isdisplayedinFigure2PC2primarilyaffectedthelateraldiameterofthecranialshapeInadditionanincrementoftheposteriorpartofthecranialshapewasseenPC2accountedfor23%ofthetotalvariationForeveryPCtheeffectofthetotalvariationwascalculatedanddemonstratedinacumulativebargraphinFigure3Figure4Boxplotofthefourselectedprincipalcomponents(PCs)todistinguishscaphocephalypatientsfromthecontrols(left)andtodistinguishtrigonocephalypatientsfromthecontrols(right)They-axisdisplays the variation of the controlpopulation expressed as standard deviations Green dottedlineindicatesthemeancranialshapeofthecontrolpopulationAllthePCsinthe figureconfirmedasignificantdifference(p<0001)betweenpatientsandcontrolsSCAPHOCEPHALYThe values for thescaphocephalypatients werecalculatedusing thePCAmodelofthenormalpopulationFourPCs deviated significantly from thenormalpopulationindicatedbytheboxplotinFigure4 ThesePCscorrespondedwithanelongationintheanteroposteriordirectionbecauseofanincrementoftheposteriorpartadecreasedlateraldiameter,increasedfrontalbossingposteriornarrowingandanincreasedfrontalregionintheupwarddirectionTheabsolutevaluesofthefourselectedPCsforscaphocephalyweresummedThisresultedinameanof32(SD13)forthecontrolsandameanof134(SD27)forthescaphocephalypatientsAStudentttestconfirmedasignificantdifferencebetweenthecontrolpopulationandthescaphocephalypatients(p<0001;95%confidenceinterval87–116)For thescaphocephalypatients themean valuesof these fourPCswereusedtosimulatetheeffectin3D ThisisdemonstratedinFigure5 ThecolourmapindicatestheeffectofthefourPCscomparedwiththemeancranialshapeofthecontrolpopulation
