
Page 33 - Assessing right ventricular function and the pulmonary circulation in pulmonary hypertension Onno Anthonius Spruijt
P. 33
Decision curve analysis
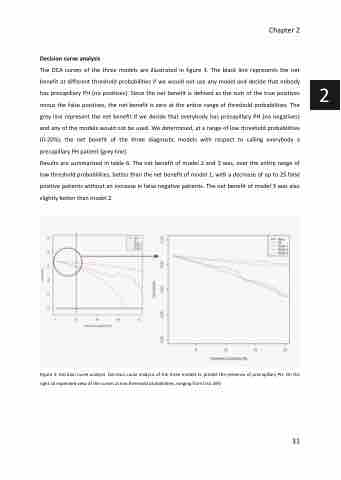
The DCA curves of the three models are illustrated in figure 3. The black line represents the net benefit at different threshold probabilities if we would not use any model and decide that nobody has precapillary PH (no positives). Since the net benefit is defined as the sum of the true positives minus the false positives, the net benefit is zero at the entire range of threshold probabilities. The grey line represent the net benefit if we decide that everybody has precapillary PH (no negatives) and any of the models would not be used. We determined, at a range of low threshold probabilities (0-20%), the net benefit of the three diagnostic models with respect to calling everybody a precapillary PH patient (grey line).
Results are summarized in table 6. The net benefit of model 2 and 3 was, over the entire range of low threshold probabilities, better than the net benefit of model 1, with a decrease of up to 25 false positive patients without an increase in false negative patients. The net benefit of model 3 was also slightly better than model 2.
Figure 3: Decision curve analysis. Decision curve analysis of the three models to predict the presence of precapillary PH. On the right an expended view of the curves at low threshold probabilities, ranging from 0 to 20%
Chapter 2
31
2
