
Page 35 - Assessing right ventricular function and the pulmonary circulation in pulmonary hypertension Onno Anthonius Spruijt
P. 35
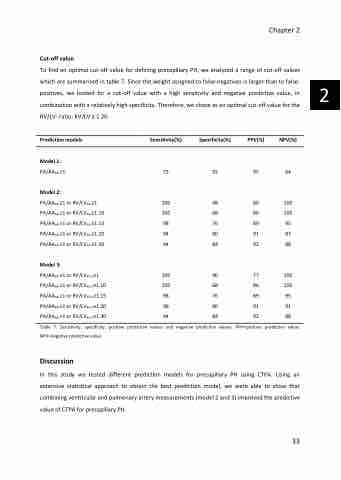
Cut-off value
To find an optimal cut-off value for defining precapillary PH, we analyzed a range of cut-off values which are summarized in table 7. Since the weight assigned to false-negatives is larger than to false- positives, we looked for a cut-off value with a high sensitivity and negative predictive value, in combination with a relatively high specificity. Therefore, we chose as an optimal cut-off value for the RV/LV- ratio: RV/LV ≥ 1.20.
Chapter 2
         Prediction models Model 1:
PA/AAAX ≥1
Model 2:
PA/AAAX ≥1 PA/AAAX ≥1 PA/AAAX ≥1 PA/AAAX ≥1 PA/AAAX ≥1
Model 3:
PA/AAAX ≥1
PA/AAAX ≥1
PA/AAAX ≥1
PA/AAAX ≥1
PA/AAAX ≥1
Table 7: Sensitivity, specificity, positive predictive values and negative predictive values. PPV=positive predictive value; NPV=negative predictive value.
Discussion
In this study we tested different prediction models for precapillary PH using CTPA. Using an extensive statistical approach to obtain the best prediction model, we were able to show that combining ventricular and pulmonary artery measurements (model 2 and 3) improved the predictive value of CTPA for precapillary PH.
        or RV/LVAX ≥1
or RV/LVAX ≥1.10 or RV/LVAX ≥1.15 or RV/LVAX ≥1.20 or RV/LVAX ≥1.30
Sensitivity(%) Specificity(%)
75 92
100 48 100 68 98 76 94 80 94 84
PPV(%) NPV(%)
95 64
80 100 86 100 89 95 91 87 92 88
or RV/LV4CH ≥1
or RV/LV4CH ≥1.10 or RV/LV4CH ≥1.15 or RV/LV4CH ≥1.20 or RV/LV4CH ≥1.30
100 40 100 68 98 76 96 80 94 84
77 100 86 100 89 95 91 91 92 88
     33
2
