
Page 31 - Assessing right ventricular function and the pulmonary circulation in pulmonary hypertension Onno Anthonius Spruijt
P. 31
Chapter 2
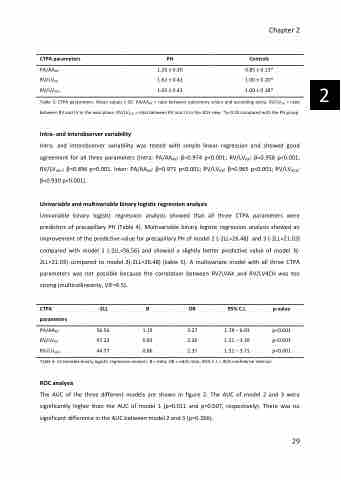
CTPA parameters
PA/AAAX
RV/LVAX
RV/LV4CH
Table 3: CTPA parameters. Mean values ± SD. PA/AAAX = ratio between pulmonary artery and ascending aorta. RV/LVAX = ratio between RV and LV in the axial plane. RV/LV4CH = ratio between RV and LV in the 4CH view. *p<0.05 compared with the PH group.
Intra- and interobserver variability
Intra- and interobserver variability was tested with simple linear regression and showed good agreement for all three parameters (Intra: PA/AAAX: β=0.974 p<0.001; RV/LVAX: β=0.958 p<0.001; RV/LV4CH: β=0.896 p=0.001. Inter: PA/AAAX: β=0.971 p<0.001; RV/LVAX: β=0.965 p<0.001; RV/LV4CH: β=0.930 p<0.001).
Univariable and multivariable binary logistic regression analysis
Univariable binary logistic regression analysis showed that all three CTPA parameters were predictors of precapillary PH (Table 4). Multivariable binary logistic regression analysis showed an improvement of the predictive value for precapillary PH of model 2 (-2LL=26.48) and 3 (-2LL=21.03) compared with model 1 (-2LL=56.56) and showed a slightly better predictive value of model 3(- 2LL=21.03) compared to model 2(-2LL=26.48) (table 5). A multivariate model with all three CTPA parameters was not possible because the correlation between RV/LVAX and RV/LV4CH was too strong (multicollinearity, VIF=6.5).
CTPA -2LL B OR 95%C.I. p-value parameters
PH
Controls
1.20 ± 0.30 1.62 ± 0.42 1.65 ± 0.42
0.85 ± 0.13* 1.00 ± 0.20* 1.00 ± 0.18*
PA/AAAX 56.56 1.19 3.27
RV/LVAX 47.22 0.82 2.26
RV/LV4CH 44.77 0.86 2.37
Table 4: Univariable binary logistic regression analysis. B = beta; OR = odds ratio; 95% C.I. = 95% confidence interval.
ROC analysis
p<0.001 p<0.001 p<0.001
1.78 – 6.03 1.51 – 3.39 1.51 – 3.71
The AUC of the three different models are shown in figure 2. The AUC of model 2 and 3 were significantly higher than the AUC of model 1 (p=0.011 and p=0.007, respectively). There was no significant difference in the AUC between model 2 and 3 (p=0.266).
29
2
