
Page 195 - Demo
P. 195
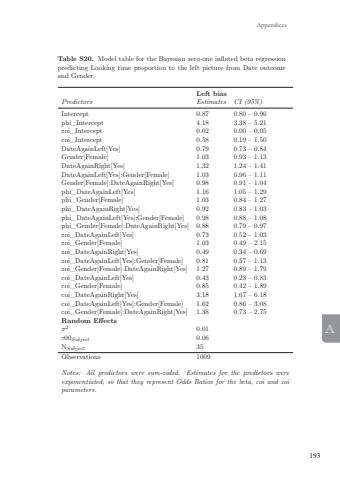
193AppendicesATable S16. Model table for the Bayesian zero-one inflated beta regres,sion predicting Looking time proportion to the left picture from Post-dateattractiveness rating and Gender.Left biasPredictors Estimates CI (95%)Intercept 0.93 0.85 – 1.01phi_Intercept 4.49 3.62 – 5.53zoi_Intercept 0.01 0.00 – 0.04coi_Intercept 0.70 0.18 – 2.21AttractivenessLeft 1.21 1.15 – 1.26Gender[Female] 1.01 0.93 – 1.09AttractivenessRight 0.79 0.75 – 0.82AttractivenessLeft:Gender[Female] 0.98 0.94 – 1.02Gender[Female]:AttractivenessRight 1.07 1.02 – 1.11phi_AttractivenessLeft 0.90 0.84 – 0.97phi_Gender[Female] 0.94 0.76 – 1.16phi_AttractivenessRight 1.02 0.95 – 1.10phi_AttractivenessLeft:Gender[Female] 1.03 0.95 – 1.10phi_Gender[Female]:AttractivenessRight 1.00 0.93 – 1.07zoi_AttractivenessLeft 1.26 0.99 – 1.63zoi_Gender[Female] 1.09 0.51 – 2.31zoi_AttractivenessRight 1.60 1.26 – 2.08zoi_AttractivenessLeft:Gender[Female] 1.07 0.84 – 1.36zoi_Gender[Female]:AttractivenessRight 0.79 0.61 – 1.00coi_AttractivenessLeft 1.84 1.19 – 2.95coi_Gender[Female] 0.98 0.46 – 2.23coi_ AttractivenessRight 0.57 0.36 – 0.87coi_AttractivenessLeft:Gender[Female] 0.88 0.56 – 1.45coi_Gender[Female]:AttractivenessRight 1.14 0.73 – 1.80Random Effectsσ2 0.01τ00Subject 0.06NSubject 35Observations 1009Notes: Gender was sum-coded, while Post-date attractiveness ratings werecentered around 4 (the middle option). Estimates for the predictors wereexponentiated, so that they represent Odds Ratios for the beta, coi and zoiparameters.Table S17. Total number of trials per level of the predictors per GenderFemale (N = 24) Male (N = 32)Date outcome probe0 (= no interest) 277 3261 (= interest) 140 266Date outcome distractor0 272 3261 145 266Table S18. Average Bias score (proportion of time looking at left picture)and SD (between brackets) per level of Date outcome of the left picture andGender.0 1female 0.45 (0.27) 0.51 (0.3)male 0.39 (0.25) 0.56 (0.28)Table S19. Average Bias score (proportion of time looking at left picture)and SD (between brackets) per level of Date outcome of the left picture andGender.0 1female 0.52 (0.29) 0.37 (0.24)male 0.53 (0.26) 0.38 (0.27)Table S20. Model table for the Bayesian zero-one inflated beta regressionpredicting Looking time proportion to the left picture from Date outcomeand Gender.Left biasPredictors Estimates CI (95%)Intercept 0.87 0.80 – 0.96phi_Intercept 4.18 3.38 – 5.21zoi_Intercept 0.02 0.00 – 0.05coi_Intercept 0.58 0.19 – 1.50DateAgainLeft[Yes] 0.79 0.73 – 0.84Gender[Female] 1.03 0.93 – 1.13DateAgainRight[Yes] 1.32 1.24 – 1.41DateAgainLeft[Yes]:Gender[Female] 1.03 0.96 – 1.11Gender[Female]:DateAgainRight[Yes] 0.98 0.91 – 1.04phi_DateAgainLeft[Yes] 1.16 1.05 – 1.29phi_Gender[Female] 1.03 0.84 – 1.27phi_DateAgainRight[Yes] 0.92 0.83 – 1.03phi_DateAgainLeft[Yes]:Gender[Female] 0.98 0.88 – 1.08phi_Gender[Female]:DateAgainRight[Yes] 0.88 0.79 – 0.97zoi_DateAgainLeft[Yes] 0.73 0.52 – 1.03zoi_Gender[Female] 1.03 0.49 – 2.15zoi_DateAgainRight[Yes] 0.49 0.34 – 0.69zoi_DateAgainLeft[Yes]:Gender[Female] 0.81 0.57 – 1.13zoi_Gender[Female]:DateAgainRight[Yes] 1.27 0.89 – 1.79coi_DateAgainLeft[Yes] 0.43 0.23 – 0.83coi_Gender[Female] 0.85 0.42 – 1.89coi_DateAgainRight[Yes] 3.18 1.67 – 6.18coi_DateAgainLeft[Yes]:Gender[Female] 1.62 0.86 – 3.08coi_Gender[Female]:DateAgainRight[Yes] 1.38 0.73 – 2.75Random Effectsσ2 0.01τ00Subject 0.06NSubject 35Observations 1009Notes: All predictors were sum-coded. Estimates for the predictors wereexponentiated, so that they represent Odds Ratios for the beta, coi and zoiparameters.Table S21. Model table for the Bayesian mixed model that predicts RTfrom Pre-date attractiveness ratings and Gender. This analysis was performed on the complete cases-dataset.RTPredictors Estimates CI (95%)Estimates CI (95%)1.190.74PredictorsInterceptGender[Female]AttractivenessDistractor 2.06-0.93 – 3.34-1.49 – 2.920.61 – 3.48-2.83 – 0.65-1.52 – 1.280.28 – 3.79AttractivenessProbe -1.11Gender[Female]:AttractivenessDistractor -0.10Gender[Female]:AttractivenessProbe 2.06Random Effects2580.382.295.2419.83σ2τ00Subjectτ11Subject:AttractivenessDistractorτ11Subject:AttractivenessP robeNSubject 55Observations 3198Table S22. Model table for the Bayesian mixed model that predicts RTfrom Post-date attractiveness ratings and Gender. This analysis was performed on the complete cases-dataset.RTPredictors Estimates CI (95%)Predictors Estimates CI (95%)Intercept 0.38Gender[Female] -0.27AttractivenessDistractor 1.78AttractivenessProbe -0.91-1.38 – 2.19-2.19 – 1.630.55 – 3.01-2.48 – 0.64-0.77 – 1.68-0.38 – 2.75Gender[Female]: AttractivenessDistractor 0.46Gender[Female]: AttractivenessProbe 1.19Random Effects2581.061.301.7313.89σ2τ00Subjectτ11Subject:AttractivenessDistractorτ11Subject:AttractivenessP robeNSubject 55Observations 3198Notes: Gender was sum-coded, while Post-date attractiveness ratings werecentered around 4 (the middle option).Iliana Samara 17x24.indd 193 08-04-2024 16:37
