
Page 193 - Demo
P. 193
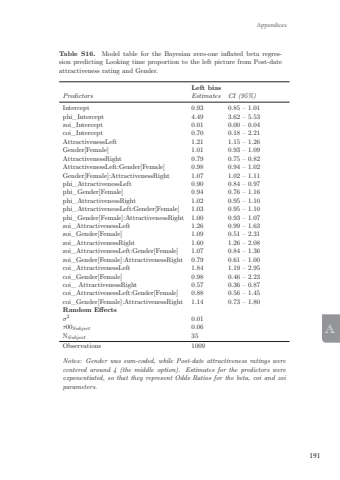
191AppendicesATable S13. Model table for the Bayesian zero-one inflated beta regres,sion predicting Looking time proportion to the left picture from Pre-dateattractiveness rating and Gender.Left biasPredictors Estimates CI (95%)Intercept 0.97 0.91 – 1.04phi_Intercept 5.44 4.52 – 6.56zoi_Intercept 0.02 0.01 – 0.06coi_Intercept 0.86 0.43 – 1.69AttractivenessLeft 1.39 1.34 – 1.44Gender[Female] 1.00 0.94 – 1.06AttractivenessRight 0.69 0.67 – 0.71AttractivenessLeft:Gender[Female] 0.98 0.95 – 1.02Gender[Female]:AttractivenessRight 1.01 0.98 – 1.05phi_AttractivenessLeft 0.96 0.90 – 1.02phi_Gender[Female] 0.97 0.80 – 1.17phi_AttractivenessRight 0.97 0.91 – 1.03phi_AttractivenessLeft:Gender[Female] 1.02 0.95 – 1.09phi_Gender[Female]:AttractivenessRight 1.02 0.96 – 1.09zoi_AttractivenessLeft 1.19 1.00 – 1.43zoi_Gender[Female] 1.10 0.55 – 2.21zoi_AttractivenessRight 1.58 1.32 – 1.92zoi_AttractivenessLeft:Gender[Female] 0.98 0.83 – 1.17zoi_Gender[Female]:AttractivenessRight 0.93 0.77 – 1.12coi_AttractivenessLeft 1.93 1.43 – 2.67coi_Gender[Female] 0.85 0.48 – 1.52coi_ AttractivenessRight 0.42 0.28 – 0.61coi_AttractivenessLeft:Gender[Female] 0.86 0.63 – 1.17coi_Gender[Female]:AttractivenessRight 1.40 0.96 – 2.12Random Effectsσ2 0.01τ00Subject 0.06NSubject 35Observations 1569Notes: Gender was sum-coded, while Pre-date attractiveness ratings werecentered around 4 (the middle option). Estimates for the predictors wereexponentiated, so that they represent Odds Ratios for the beta, coi and zoiparameters.Table S14. Slope estimates at different levels of Pre-date attractivenessrating (both left and right picture).pre-date attr. rating left picture Median estimate [MAD] 89% CrI pd-3 0.068 [.0028] 0.063, 0.072 1.00-2 0.077 [.0039] 0.071, 0.083 1.00-1 0.084 [.0048] 0.077, 0.092 1.000 0.087 [.0050] 0.079, 0.095 1.001 0.083 [.0044] 0.076, 0.090 1.002 0.074 [.0032] 0.069, 0.079 1.003 0.063 [.0020] 0.059, 0.066 1.00pre-date attr. rating right picture Median estimate [MAD] 89% CrI pd-3 -0.078 [.0025] -0.081, -0.073 1.00-2 -0.088 [.0038] -0.094, -0.082 1.00-1 -0.096 [.0046] -0.103, -0.088 1.000 -0.098 [.0048] -0.106, -0.091 1.001 -0.091 [.0041] -0.098, -0.085 1.002 -0.077 [.0028] -0.082, -0.073 1.003 -0.061 [.0019] -0.064, -0.058 1.00Table S15. Difference in slope between women and men at different levelsof Pre-date attractiveness rating (both left and right picture).pre-date attr. rating left picture Median estimate [MAD] 89% CrI pd-3 -.0052 [.0055] -0.014, 0.004 0.83-2 -.0075 [.0076] -0.021, 0.004 0.84-1 -.0094 [.0094] -0.025, 0.006 0.840 -.0097 [.0100] -0.026, 0.007 0.831 -.0075 [.0088] -0.021, 0.007 0.812 -.0043 [.0064] -0.015, 0.006 0.753 -.0013 [.0040] -0.008, 0.005 0.64pre-date attr. rating right picture Median estimate [MAD] 89% CrI pd-3 .000 [.005] -0.009, 0.010 0.50-2 .001 [.008] -0.014, 0.015 0.54-1 .005 [.009] -0.014, 0.022 0.700 .012 [.010] -0.006, 0.032 0.911 .013 [.008] -0.002, 0.030 0.952 .008 [.006] -0.003, 0.020 0.943 .003 [.004] -0.004, 0.011 0.82Table S14. Slope estimates at different levels of Pre-date attractivenessrating (both left and right picture).pre-date attr. rating left picture Median estimate [MAD] 89% CrI pd-3 0.068 [.0028] 0.063, 0.072 1.00-2 0.077 [.0039] 0.071, 0.083 1.00-1 0.084 [.0048] 0.077, 0.092 1.000 0.087 [.0050] 0.079, 0.095 1.001 0.083 [.0044] 0.076, 0.090 1.002 0.074 [.0032] 0.069, 0.079 1.003 0.063 [.0020] 0.059, 0.066 1.00pre-date attr. rating right picture Median estimate [MAD] 89% CrI pd-3 -0.078 [.0025] -0.081, -0.073 1.00-2 -0.088 [.0038] -0.094, -0.082 1.00-1 -0.096 [.0046] -0.103, -0.088 1.000 -0.098 [.0048] -0.106, -0.091 1.001 -0.091 [.0041] -0.098, -0.085 1.002 -0.077 [.0028] -0.082, -0.073 1.003 -0.061 [.0019] -0.064, -0.058 1.00Table S15. Difference in slope between women and men at different levelsof Pre-date attractiveness rating (both left and right picture).pre-date attr. rating left picture Median estimate [MAD] 89% CrI pd-3 -.0052 [.0055] -0.014, 0.004 0.83-2 -.0075 [.0076] -0.021, 0.004 0.84-1 -.0094 [.0094] -0.025, 0.006 0.840 -.0097 [.0100] -0.026, 0.007 0.831 -.0075 [.0088] -0.021, 0.007 0.812 -.0043 [.0064] -0.015, 0.006 0.753 -.0013 [.0040] -0.008, 0.005 0.64pre-date attr. rating right picture Median estimate [MAD] 89% CrI pd-3 .000 [.005] -0.009, 0.010 0.50-2 .001 [.008] -0.014, 0.015 0.54-1 .005 [.009] -0.014, 0.022 0.700 .012 [.010] -0.006, 0.032 0.911 .013 [.008] -0.002, 0.030 0.952 .008 [.006] -0.003, 0.020 0.943 .003 [.004] -0.004, 0.011 0.82Table S14. Slope estimates at different levels of Pre-date attractivenessrating (both left and right picture).pre-date attr. rating left picture Median estimate [MAD] 89% CrI pd-3 0.068 [.0028] 0.063, 0.072 1.00-2 0.077 [.0039] 0.071, 0.083 1.00-1 0.084 [.0048] 0.077, 0.092 1.000 0.087 [.0050] 0.079, 0.095 1.001 0.083 [.0044] 0.076, 0.090 1.002 0.074 [.0032] 0.069, 0.079 1.003 0.063 [.0020] 0.059, 0.066 1.00pre-date attr. rating right picture Median estimate [MAD] 89% CrI pd-3 -0.078 [.0025] -0.081, -0.073 1.00-2 -0.088 [.0038] -0.094, -0.082 1.00-1 -0.096 [.0046] -0.103, -0.088 1.000 -0.098 [.0048] -0.106, -0.091 1.001 -0.091 [.0041] -0.098, -0.085 1.002 -0.077 [.0028] -0.082, -0.073 1.003 -0.061 [.0019] -0.064, -0.058 1.00Table S15. Difference in slope between women and men at different levelsof Pre-date attractiveness rating (both left and right picture).pre-date attr. rating left picture Median estimate [MAD] 89% CrI pd-3 -.0052 [.0055] -0.014, 0.004 0.83-2 -.0075 [.0076] -0.021, 0.004 0.84-1 -.0094 [.0094] -0.025, 0.006 0.840 -.0097 [.0100] -0.026, 0.007 0.831 -.0075 [.0088] -0.021, 0.007 0.812 -.0043 [.0064] -0.015, 0.006 0.753 -.0013 [.0040] -0.008, 0.005 0.64pre-date attr. rating right picture Median estimate [MAD] 89% CrI pd-3 .000 [.005] -0.009, 0.010 0.50-2 .001 [.008] -0.014, 0.015 0.54-1 .005 [.009] -0.014, 0.022 0.700 .012 [.010] -0.006, 0.032 0.911 .013 [.008] -0.002, 0.030 0.952 .008 [.006] -0.003, 0.020 0.943 .003 [.004] -0.004, 0.011 0.82Table S14. Slope estimates at different levels of Pre-date attractivenessrating (both left and right picture).pre-date attr. rating left picture Median estimate [MAD] 89% CrI pd-3 0.068 [.0028] 0.063, 0.072 1.00-2 0.077 [.0039] 0.071, 0.083 1.00-1 0.084 [.0048] 0.077, 0.092 1.000 0.087 [.0050] 0.079, 0.095 1.001 0.083 [.0044] 0.076, 0.090 1.002 0.074 [.0032] 0.069, 0.079 1.003 0.063 [.0020] 0.059, 0.066 1.00pre-date attr. rating right picture Median estimate [MAD] 89% CrI pd-3 -0.078 [.0025] -0.081, -0.073 1.00-2 -0.088 [.0038] -0.094, -0.082 1.00-1 -0.096 [.0046] -0.103, -0.088 1.000 -0.098 [.0048] -0.106, -0.091 1.001 -0.091 [.0041] -0.098, -0.085 1.002 -0.077 [.0028] -0.082, -0.073 1.003 -0.061 [.0019] -0.064, -0.058 1.00Table S15. Difference in slope between women and men at different levelsof Pre-date attractiveness rating (both left and right picture).pre-date attr. rating left picture Median estimate [MAD] 89% CrI pd-3 -.0052 [.0055] -0.014, 0.004 0.83-2 -.0075 [.0076] -0.021, 0.004 0.84-1 -.0094 [.0094] -0.025, 0.006 0.840 -.0097 [.0100] -0.026, 0.007 0.831 -.0075 [.0088] -0.021, 0.007 0.812 -.0043 [.0064] -0.015, 0.006 0.753 -.0013 [.0040] -0.008, 0.005 0.64pre-date attr. rating right picture Median estimate [MAD] 89% CrI pd-3 .000 [.005] -0.009, 0.010 0.50-2 .001 [.008] -0.014, 0.015 0.54-1 .005 [.009] -0.014, 0.022 0.700 .012 [.010] -0.006, 0.032 0.911 .013 [.008] -0.002, 0.030 0.952 .008 [.006] -0.003, 0.020 0.943 .003 [.004] -0.004, 0.011 0.82Table S16. Model table for the Bayesian zero-one inflated beta regression predicting Looking time proportion to the left picture from Post-dateattractiveness rating and Gender.Left biasPredictors Estimates CI (95%)Intercept 0.93 0.85 – 1.01phi_Intercept 4.49 3.62 – 5.53zoi_Intercept 0.01 0.00 – 0.04coi_Intercept 0.70 0.18 – 2.21AttractivenessLeft 1.21 1.15 – 1.26Gender[Female] 1.01 0.93 – 1.09AttractivenessRight 0.79 0.75 – 0.82AttractivenessLeft:Gender[Female] 0.98 0.94 – 1.02Gender[Female]:AttractivenessRight 1.07 1.02 – 1.11phi_AttractivenessLeft 0.90 0.84 – 0.97phi_Gender[Female] 0.94 0.76 – 1.16phi_AttractivenessRight 1.02 0.95 – 1.10phi_AttractivenessLeft:Gender[Female] 1.03 0.95 – 1.10phi_Gender[Female]:AttractivenessRight 1.00 0.93 – 1.07zoi_AttractivenessLeft 1.26 0.99 – 1.63zoi_Gender[Female] 1.09 0.51 – 2.31zoi_AttractivenessRight 1.60 1.26 – 2.08zoi_AttractivenessLeft:Gender[Female] 1.07 0.84 – 1.36zoi_Gender[Female]:AttractivenessRight 0.79 0.61 – 1.00coi_AttractivenessLeft 1.84 1.19 – 2.95coi_Gender[Female] 0.98 0.46 – 2.23coi_ AttractivenessRight 0.57 0.36 – 0.87coi_AttractivenessLeft:Gender[Female] 0.88 0.56 – 1.45coi_Gender[Female]:AttractivenessRight 1.14 0.73 – 1.80Random Effectsσ2 0.01τ00Subject 0.06NSubject 35Observations 1009Notes: Gender was sum-coded, while Post-date attractiveness ratings werecentered around 4 (the middle option). Estimates for the predictors wereexponentiated, so that they represent Odds Ratios for the beta, coi and zoiparameters.Table S17. Total number of trials per level of the predictors per GenderFemale (N = 24) Male (N = 32)Date outcome probe0 (= no interest) 277 3261 (= interest) 140 266Date outcome distractor0 272 3261 145 266Table S18. Average Bias score (proportion of time looking at left picture)and SD (between brackets) per level of Date outcome of the left picture andGender.0 1female 0.45 (0.27) 0.51 (0.3)male 0.39 (0.25) 0.56 (0.28)Table S19. Average Bias score (proportion of time looking at left picture)and SD (between brackets) per level of Date outcome of the left picture andGender.0 1female 0.52 (0.29) 0.37 (0.24)male 0.53 (0.26) 0.38 (0.27)Iliana Samara 17x24.indd 191 08-04-2024 16:37
