
Page 90 - Exploring the Potential of Self-Monitoring Kidney Function After Transplantation - Céline van Lint
P. 90
88
Chapter 4
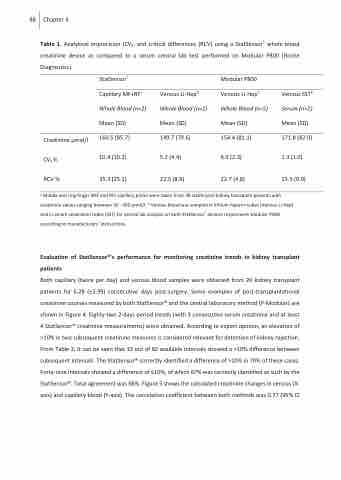
Table 1. Analytical imprecision (CVa) and critical differences (RCV) using a StatSensor® whole blood creatinine device as compared to a serum central lab test performed on Modular P800 (Roche Diagnostics).
Creatinine μmol/l
CVa %
RCV %
StatSensor® Capillary MF+RFa Whole Blood (n=2) Mean (SD)
160.5 (85.7)
10.4 (10.2)
35.3 (25.2)
Venous Li-Hepb
Whole Blood (n=2)
Mean (SD) 149.7 (79.6)
5.2 (4.4)
22.5 (8.9)
Modular P800 Venous Li-Hepb Whole Blood (n=5) Mean (SD)
154.4 (81.1) 6.0 (2.3)
22.7 (4.8)
Venous SSTb
Serum (n=2)
Mean (SD) 171.8 (82.0)
1.3 (1.0) 15.5 (0.9)
a Middle and ring finger (MF and RF) capillary pricks were taken from 38 stable post-kidney transplant patients with creatinine values ranging between 50 - 450 μmol/l. b Venous blood was sampled in lithium heparin tubes (Venous Li-Hep) and in serum separation tubes (SST) for central lab analysis on both StatSensor® devices respectively Modular P800 according to manufacturers’ instructions.
Evaluation of StatSensor®’s performance for monitoring creatinine trends in kidney transplant patients
Both capillary (twice per day) and venous blood samples were obtained from 20 kidney transplant patients for 6.28 (±2.99) consecutive days post-surgery. Some examples of post-transplantational creatinine courses measured by both StatSensor® and the central laboratory method (P-Modular) are shown in Figure 4. Eighty-two 2-days period trends (with 3 consecutive serum creatinine and at least 4 StatSensor® creatinine measurements) were obtained. According to expert opinion, an elevation of >10% in two subsequent creatinine measures is considered relevant for detection of kidney rejection. From Table 2, it can be seen that 33 out of 82 available intervals showed a >10% difference between subsequent intervals. The StatSensor® correctly identified a difference of >10% in 70% of these cases. Forty-nine intervals showed a difference of ≤10%, of which 67% was correctly identified as such by the StatSensor®. Total agreement was 68%. Figure 5 shows the calculated creatinine changes in venous (X- axis) and capillary blood (Y-axis). The correlation coefficient between both methods was 0.77 (95% CI
