
Page 91 - Exploring the Potential of Self-Monitoring Kidney Function After Transplantation - Céline van Lint
P. 91
Application of a creatinine device for trend monitoring 89
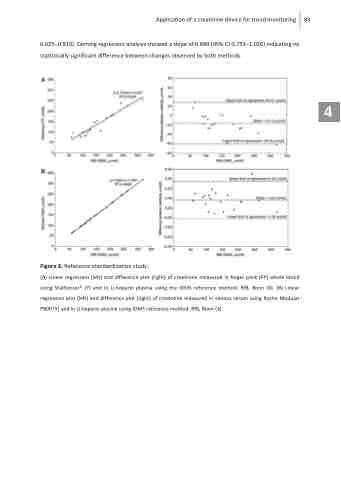
0.625–0.910). Deming regression analysis showed a slope of 0.889 (95% CI 0.753–1.026) indicating no statistically significant difference between changes observed by both methods.
Figure 3: Reference standardization study.
(A) Linear regression (left) and difference plot (right) of creatinine measured in finger prick (FP) whole blood using StatSensor® (Y) and in Li-heparin plasma using the IDMS reference method, RfB, Bonn (X). (B) Linear regression plot (left) and difference plot (right) of creatinine measured in venous serum using Roche Modular P800 (Y) and in Li-heparin plasma using IDMS reference method, RfB, Bonn (X).
4
