
Page 88 - Exploring the Potential of Self-Monitoring Kidney Function After Transplantation - Céline van Lint
P. 88
86
Chapter 4
laboratory method was available. For the capillary blood measurements, the mean creatinine level was 161 ± 86 μmol/L. For the lithium heparin samples, the mean creatinine level was 150 ± 80 μmol/L for StatSensor® measurements and 154.4 ± 81.1 for the central laboratory methods. The cor- responding mean serum creatinine level according to the central laboratory method was 172 ± 82 μmol/L. The average error index(Y-X)/TEa between the StatSensor® capillary result and central laboratory serum creatinine result was –0.96 with a range of –6.61 to 5.42. The difference between the StatSensor® and the central laboratory method was within the TEa for only 15 out of 38 (39.5%) specimens. The largest error index occurred at a concentration of 107.5 μmol/L (see Figure 2A). Average overall CVa for StatSensor (n=38) was 10.4% and 5.2% using the capillary respectively venous whole blood results (Table 1), which is far above the desirable imprecision of 2.2% [22]. For the central laboratory serum creatinine method, overall CVa is <1.5%, and thus well below the desirable imprecision. As RCVs depend on the analytical imprecision of the method used, different RCVs will be found depending on the method used. RCVs for StatSensor® in capillary and heparinized venous whole blood are 35% and 23%, respectively, compared to 15.5% for the central laboratory method.
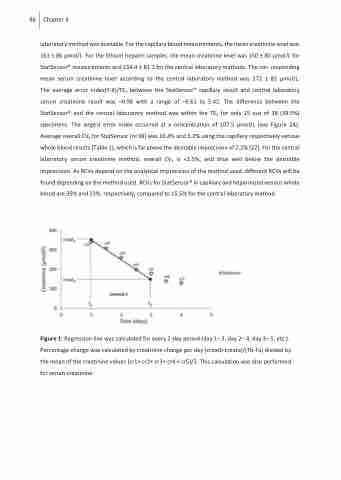
Figure 1: Regression line was calculated for every 2-day period (day 1– 3, day 2– 4, day 3– 5, etc.). Percentage change was calculated by creatinine change per day (creatb-creata)/(Tb-Ta) divided by the mean of the creatinine values (cr1+ cr2+ cr3+ cr4 + cr5)/5. This calculation was also performed for serum creatinine.
