
Page 92 - Exploring the Potential of Self-Monitoring Kidney Function After Transplantation - Céline van Lint
P. 92
90
Chapter 4
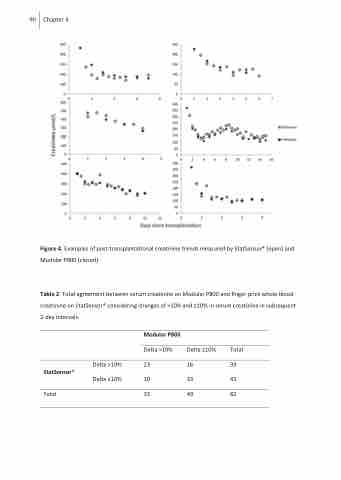
Figure 4. Examples of post-transplantational creatinine trends measured by StatSensor® (open) and Modular P800 (closed).
Table 2. Total agreement between serum creatinine on Modular P800 and finger prick whole blood creatinine on StatSensor® considering changes of >10% and ≤10% in serum creatinine in subsequent 2-day intervals.
StatSensor® Total
Delta >10% Delta ≤10%
Modular P800
Delta >10% 23
10
33
Delta ≤10% Total 16 39 33 43 49 82
