
Page 89 - Exploring the Potential of Self-Monitoring Kidney Function After Transplantation - Céline van Lint
P. 89
Application of a creatinine device for trend monitoring 87
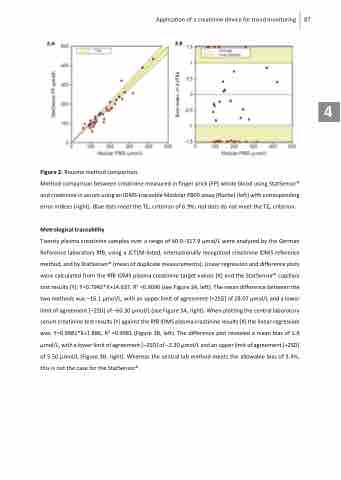
Figure 2: Routine method comparison.
Method comparison between creatinine measured in finger prick (FP) whole blood using StatSensor® and creatinine in serum using an IDMS-traceable Modular P800 assay (Roche) (left) with corresponding error indices (right). Blue dots meet the TEa criterion of 6.9%; red dots do not meet the TEa criterion.
Metrological traceability
Twenty plasma creatinine samples over a range of 60.0–317.9 μmol/L were analyzed by the German Reference laboratory RfB, using a JCTLM-listed, internationally recognized creatinine IDMS reference method, and by StatSensor® (mean of duplicate measurements). Linear regression and difference plots were calculated from the RfB IDMS plasma creatinine target values (X) and the StatSensor® capillary test results (Y): Y=0.7942*X+14.637, R2 =0.9096 (see Figure 3A, left). The mean difference between the two methods was –16.1 μmol/L, with an upper limit of agreement [+2SD] of 28.07 μmol/L and a lower limit of agreement [–2SD] of –60.30 μmol/L (see Figure 3A, right). When plotting the central laboratory serum creatinine test results (Y) against the RfB IDMS plasma creatinine results (X) the linear regression was: Y=0.9981*X+1.886, R2 =0.9981 (Figure 3B, left). The difference plot revealed a mean bias of 1.6 μmol/L, with a lower limit of agreement [–2SD] of –2.30 μmol/L and an upper limit of agreement [+2SD] of 5.50 μmol/L (Figure 3B, right). Whereas the central lab method meets the allowable bias of 3.4%, this is not the case for the StatSensor®.
4
