
Page 123 - Functional impairment and cues for rehabilitation of head and neck cancer patients -
P. 123
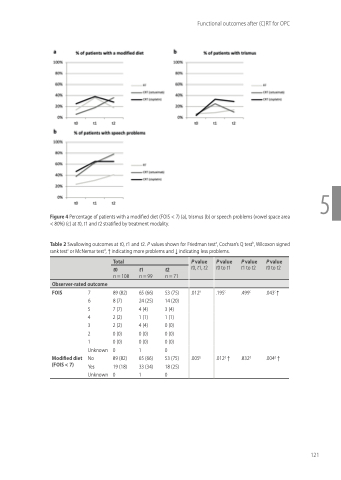
Functional outcomes after (C)RT for OPC
    Figure 4 Percentage of patients with a modified diet (FOIS < 7) (a), trismus (b) or speech problems (vowel space area < 80%) (c) at t0, t1 and t2 stratified by treatment modality.
Table 2 Swallowing outcomes at t0, t1 and t2. P values shown for Friedman testa, Cochran’s Q testb, Wilcoxon signed rank testc or McNemar testd, ↑ indicating more problems and ↓ indicating less problems.
5
        Total
P value t0, t1, t2
P value t0 to t1
P value t1 to t2
P value t0 to t2
     Observer-rated outcome
t0
n = 108
t1
n = 99
t2
n = 71
                    .012a
.005b
                       FOIS
Modified diet (FOIS < 7)
7 89 (82)
65 (66) 24 (25) 4 (4)
1 (1)
4 (4)
0 (0)
0 (0)
1
65 (66) 33 (34) 1
53 (75) 14 (20) 3 (4)
1 (1)
0 (0)
0 (0)
0 (0)
0
53 (75) 18 (25) 0
.195c
.012d ↑
.499c .043c ↑
.832d .004d ↑
6 8
5 7
4 2
3 2
2 0
1 0 Unknown 0
No 89 (82) Yes 19 (18) Unknown 0
(7) (7) (2) (2) (0) (0)
  121
