
Page 122 - Functional impairment and cues for rehabilitation of head and neck cancer patients -
P. 122
Chapter 5
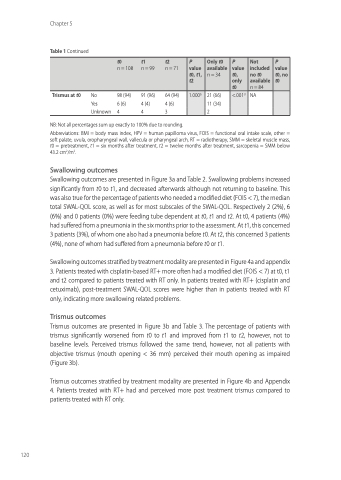
Table 1 Continued
Trismus at t0 No 98 (94) Yes 6 (6)
Unknown 4
91 (96) 4 (4)
4
64 (94) 4 (6)
3
t0
n = 108
t1
n = 99
t2
n = 71
P
value t0, t1, t2
Only t0 available n = 34
P
value t0, only t0
Not included no t0 available n = 84
P
value t0, no t0
1.000b
21 (66) 11 (34) 2
<.001d
NA
120
NB: Not all percentages sum up exactly to 100% due to rounding.
Abbreviations: BMI = body mass index, HPV = human papilloma virus, FOIS = functional oral intake scale, other = soft palate, uvula, oropharyngeal wall, vallecula or pharyngeal arch, RT = radiotherapy, SMM = skeletal muscle mass, t0 = pretreatment, t1 = six months after treatment, t2 = twelve months after treatment, sarcopenia = SMM below 43.2 cm2/m2.
Swallowing outcomes
Swallowing outcomes are presented in Figure 3a and Table 2. Swallowing problems increased significantly from t0 to t1, and decreased afterwards although not returning to baseline. This was also true for the percentage of patients who needed a modified diet (FOIS < 7), the median total SWAL-QOL score, as well as for most subscales of the SWAL-QOL. Respectively 2 (2%), 6 (6%) and 0 patients (0%) were feeding tube dependent at t0, t1 and t2. At t0, 4 patients (4%) had suffered from a pneumonia in the six months prior to the assessment. At t1, this concerned 3 patients (3%), of whom one also had a pneumonia before t0. At t2, this concerned 3 patients (4%), none of whom had suffered from a pneumonia before t0 or t1.
Swallowing outcomes stratified by treatment modality are presented in Figure 4a and appendix 3. Patients treated with cisplatin-based RT+ more often had a modified diet (FOIS < 7) at t0, t1 and t2 compared to patients treated with RT only. In patients treated with RT+ (cisplatin and cetuximab), post-treatment SWAL-QOL scores were higher than in patients treated with RT only, indicating more swallowing related problems.
Trismus outcomes
Trismus outcomes are presented in Figure 3b and Table 3. The percentage of patients with trismus significantly worsened from t0 to t1 and improved from t1 to t2, however, not to baseline levels. Perceived trismus followed the same trend, however, not all patients with objective trismus (mouth opening < 36 mm) perceived their mouth opening as impaired (Figure 3b).
Trismus outcomes stratified by treatment modality are presented in Figure 4b and Appendix 4. Patients treated with RT+ had and perceived more post treatment trismus compared to patients treated with RT only.
