
Page 124 - Functional impairment and cues for rehabilitation of head and neck cancer patients -
P. 124
Chapter 5
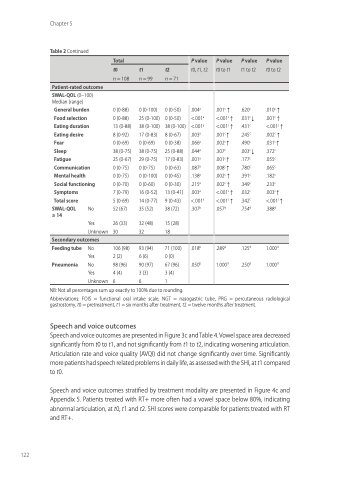
Table 2 Continued
SWAL-QOL (0–100) Median (range)
General burden Food selection Eating duration Eating desire Fear
Sleep
Fatigue Communication Mental health Social functioning Symptoms
Total score
0 (0-88) 0 (0-88) 13 (0-88) 8 (0-92) 0 (0-69) 38 (0-75) 25 (0-67) 0 (0-75) 0 (0-75) 0 (0-70) 7 (0-79) 5 (0-69) 52 (67)
26 (33) 30
106 (98) 2 (2)
98 (96) 4 (4)
6
0 (0-100) 25 (0-100) 38 (0-100) 17 (0-83) 0 (0-69) 38 (0-75) 29 (0-75) 0 (0-75)
0 (0-100) 0 (0-60) 16 (0-52) 14 (0-77) 35 (52)
32 (48) 32
93 (94) 6 (6) 90 (97) 3 (3)
6
.004a .001c ↑ .620c
.010c ↑ .001c ↑ <.001c ↑ .002c ↑ .031c ↑ .372c .055c .065c .182c .233c .003c ↑ <.001c ↑ .388d
1.000d 1.000d
radiological
Total
P value t0, t1, t2
P value t0 to t1
P value t1 to t2
P value t0 to t2
Patient-rated outcome
t0
n = 108
t1
n = 99
t2
n = 71
0 (0-50)
0 (0-50)
38 (0-100) <.001a <.001c ↑ .431c
↓
↓
<.001a <.001c ↑ .031c
SWAL-QOL ≥ 14
Feeding tube Pneumonia
No
Yes Unknown
No
Yes
No
Yes Unknown
8 (0-67) 0 (0-38) 25 (0-88) 17 (0-83) 0 (0-63) 0 (0-45) 0 (0-30) 13 (0-41) 9 (0-43) 38 (72)
15 (28) 18
71 (100) 0 (0)
67 (96) 3 (4)
1
.003a .001c ↑ .245c .066a .002c ↑ .490c .044a .307c .003c .001a .001c ↑ .177c .087a .008c ↑ .780c .138a .002c ↑ .391c .215a .002c ↑ .349c .003a <.001c ↑ .032c <.001a <.001c ↑ .342c .307b .057d .754d
.289d .125d 1.000d .250d
Secondary outcomes
.018b .050b
122
to rounding.
gastrostomy, t0 = pretreatment, t1 = six months after treatment, t2 = twelve months after treatment.
Speech and voice outcomes
NB: Not all percentages sum up exactly to 100% due
Abbreviations: FOIS = functional oral intake scale, NGT = nasogastric tube, PRG = percutaneous
Speech and voice outcomes are presented in Figure 3c and Table 4. Vowel space area decreased significantly from t0 to t1, and not significantly from t1 to t2, indicating worsening articulation. Articulation rate and voice quality (AVQI) did not change significantly over time. Significantly more patients had speech related problems in daily life, as assessed with the SHI, at t1 compared to t0.
Speech and voice outcomes stratified by treatment modality are presented in Figure 4c and Appendix 5. Patients treated with RT+ more often had a vowel space below 80%, indicating abnormal articulation, at t0, t1 and t2. SHI scores were comparable for patients treated with RT and RT+.
