
Page 184 - Demo
P. 184
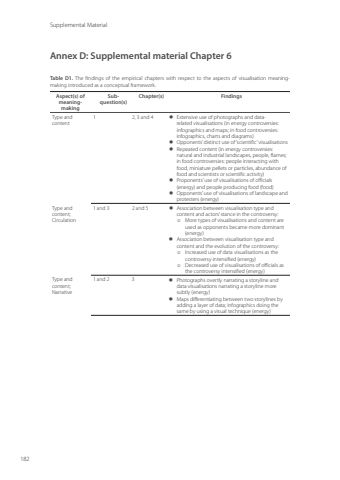
Supplemental Material182Annex D: Supplemental material Chapter 6Table D1. The findings of the empirical chapters with respect to the aspects of visualisation meaning,making introduced as a conceptual framework.Aspect(s) of meaningmakingSubquestion(s)Chapter(s) FindingsType and content1 2, 3 and 4 Extensive use of photographs and datarelated visualisations (in energy controversies: infographics and maps; in food controversies: infographics, charts and diagrams) Opponents’ distinct use of ‘scientific’ visualisations Repeated content (in energy controversies: natural and industrial landscapes, people, flames; in food controversies: people interacting with food, miniature pellets or particles, abundance of food and scientists or scientific activity) Proponents’ use of visualisations of officials (energy) and people producing food (food) Opponents’ use of visualisations of landscape and protesters (energy)Type and content; Circulation1 and 3 2 and 5 Association between visualisation type and content and actors’ stance in the controversy:o More types of visualisations and content are used as opponents became more dominant (energy) Association between visualisation type and content and the evolution of the controversy:o Increased use of data visualisations as the controversy intensified (energy)o Decreased use of visualisations of officials as the controversy intensified (energy)Type and content; Narrative1 and 2 3 Photographs overtly narrating a storyline and data visualisations narrating a storyline more subtly (energy) Maps differentiating between two storylines by adding a layer of data; infographics doing the same by using a visual technique (energy)Efrat.indd 182 19-09-2023 11:39
