
Page 52 - Demo
P. 52
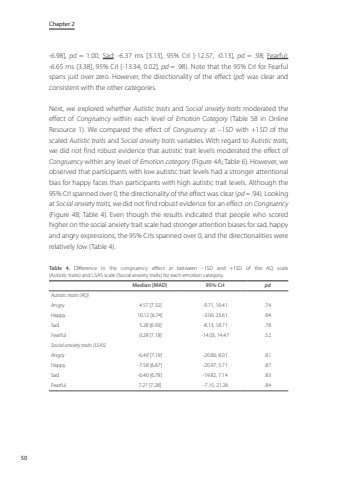
Chapter 250-6.98], pd = 1.00; Sad: -6.37 ms [3.13], 95% CrI [-12.57, -0.13], pd = .98; Fearful:-6.65 ms [3.38], 95% CrI [-13.34, 0.02], pd = .98). Note that the 95% CrI for Fearful spans just over zero. However, the directionality of the effect (pd) was clear and consistent with the other categories.Next, we explored whether Autistic traits and Social anxiety traits moderated the effect of Congruency within each level of Emotion Category (Table S8 in Online Resource 1). We compared the effect of Congruency at %u20131SD with +1SD of the scaled Autistic traits and Social anxiety traits variables. With regard to Autistic traits, we did not find robust evidence that autistic trait levels moderated the effect of Congruency within any level of Emotion category (Figure 4A; Table 6). However, we observed that participants with low autistic trait levels had a stronger attentional bias for happy faces than participants with high autistic trait levels. Although the 95% CrI spanned over 0, the directionality of the effect was clear (pd = .94). Looking at Social anxiety traits, we did not find robust evidence for an effect on Congruency (Figure 4B; Table 4). Even though the results indicated that people who scored higher on the social anxiety trait scale had stronger attention biases for sad, happy and angry expressions, the 95% CrIs spanned over 0, and the directionalities were relatively low (Table 4).Table 4. Difference in the congruency effect at between %u20131SD and +1SD of the AQ scale (Autistic traits) and LSAS scale (Social anxiety traits) for each emotion category.Median [MAD] 95% CrI pdAutistic traits (AQ)Angry 4.57 [7.32] -9.71, 19.41 .74Happy 10.12 [6.74] -3.00, 23.61 .94Sad 5.28 [6.93] -8.13, 18.71 .78Fearful 0.28 [7.18] -14.03, 14.47 .52Social anxiety traits (LSAS)Angry -6.49 [7.19] -20.80, 8.01 .81Happy -7.58 [6.87] -20.97, 5.71 .87Sad -6.40 [6.78] -19.82, 7.14 .83Fearful 7.27 [7.28] -7.15, 21.26 .84
