
Page 47 - Demo
P. 47
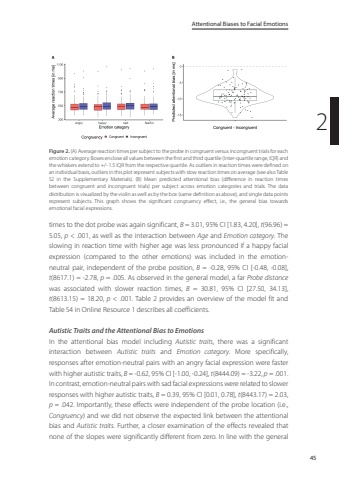
Attentional Biases to Facial Emotions452Figure 2. (A) Average reaction times per subject to the probe in congruent versus incongruent trials for each emotion category. Boxes enclose all values between the first and third quartile (Inter-quartile range, IQR) and the whiskers extend to +/- 1.5 IQR from the respective quartile. As outliers in reaction times were defined on an individual basis, outliers in this plot represent subjects with slow reaction times on average (see also Table S2 in the Supplementary Materials). (B) Mean predicted attentional bias (difference in reaction times between congruent and incongruent trials) per subject across emotion categories and trials. The data distribution is visualized by the violin as well as by the box (same definition as above), and single data points represent subjects. This graph shows the significant congruency effect, i.e., the general bias towards emotional facial expressions.times to the dot probe was again significant, B = 3.01, 95% CI [1.83, 4.20], t(96.96) = 5.05, p < .001, as well as the interaction between Age and Emotion category. The slowing in reaction time with higher age was less pronounced if a happy facial expression (compared to the other emotions) was included in the emotionneutral pair, independent of the probe position, B = -0.28, 95% CI [-0.48, -0.08], t(8617.1) = -2.78, p = .005. As observed in the general model, a far Probe distancewas associated with slower reaction times, B = 30.81, 95% CI [27.50, 34.13], t(8613.15) = 18.20, p < .001. Table 2 provides an overview of the model fit and Table S4 in Online Resource 1 describes all coefficients.Autistic Traits and the Attentional Bias to EmotionsIn the attentional bias model including Autistic traits, there was a significant interaction between Autistic traits and Emotion category. More specifically, responses after emotion-neutral pairs with an angry facial expression were faster with higher autistic traits, B = -0.62, 95% CI [-1.00, -0.24], t(8444.09) = -3.22, p = .001. In contrast, emotion-neutral pairs with sad facial expressions were related to slower responses with higher autistic traits, B = 0.39, 95% CI [0.01, 0.78], t(8443.17) = 2.03, p = .042. Importantly, these effects were independent of the probe location (i.e., Congruency) and we did not observe the expected link between the attentional bias and Autistic traits. Further, a closer examination of the effects revealed that none of the slopes were significantly different from zero. In line with the general
