
Page 49 - Demo
P. 49
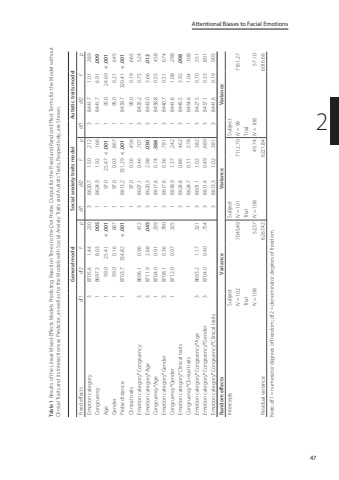
Attentional Biases to Facial Emotions472Table 1 Results of the Linear Mixed-Effects Models Predicting Reaction Times to the Dot Probe. Output for the Fixed and Random Effect Terms for the Model without Clinical Traits and its Interactions as Predictor, as well as for the Models with Social Anxiety Traits and Autistic Traits, Respectively, are Shown. General model Social anxiety traits model Autistic traits modelFixed effects df1 df2 F p df1 df2 F p df1 df2 F pEmotion category 3 8705.6 1.44 .230 3 8620.7 1.50 .212 3 8441.7 1.01 .389 Congruency 1 8697.3 8.03 .005 1 8624.9 1.92 .166 1 8441.7 6.91 .009Age 1 99.0 25.41 < .001 1 97.0 25.47 < .001 1 95.0 24.69 < .001Gender 1 99.0 0.16 .687 1 97.0 0.03 .867 1 95.0 0.21 .645 Probe distance 1 8703.7 334.82 < .001 1 8613.2 331.29 < .001 1 8439.7 320.41 < .001Clinical traits 1 97.0 0.56 .456 1 95.0 0.19 .665 Emotion category*Congruency 3 8696.1 0.96 .412 3 8607.1 0.46 .707 3 8435.2 0.75 .524 Emotion category*Age 3 8711.9 2.68 .045 3 8620.3 2.98 .030 3 8443.0 3.66 .012 Congruency*Age 1 8704.0 0.91 .339 1 8617.6 0.74 .388 1 8438.8 0.55 .458 Emotion category*Gender 3 8708.1 0.36 .780 3 8617.6 0.36 .781 3 8440.7 0.51 .674 Congruency*Gender 1 8712.0 0.97 .325 1 8618.9 1.37 .242 1 8441.6 1.08 .298 Emotion category*Clinical traits 3 8624.8 0.86 .462 3 8445.5 3.92 .008Congruency*Clinical traits 1 8624.7 0.31 .578 1 8454.6 1.04 .308 Emotion category*Congruency*Age 3 8693.2 1.17 .321 3 8601.1 1.02 .382 3 8427.5 0.70 .551 Emotion category*Congruency*Gender 3 8704.0 0.40 .754 3 8611.4 0.49 .689 3 8437.1 0.33 .801 Emotion category*Congruency*Clinical traits 3 8613.3 1.02 .381 3 8441.6 0.19 .905 Random effects Variance Variance VarianceIntercepts Subject Subject SubjectN = 102 7045.49 N = 101 7112.70 N = 99 7161.27Trial Trial TrialN = 108 52.37 N = 108 49.74 N = 108 57.10Residual variance 6267.42 6221.84 6016.66Note. df1 = numerator degrees of freedom; df2 = denominator degrees of freedom.
