
Page 50 - Demo
P. 50
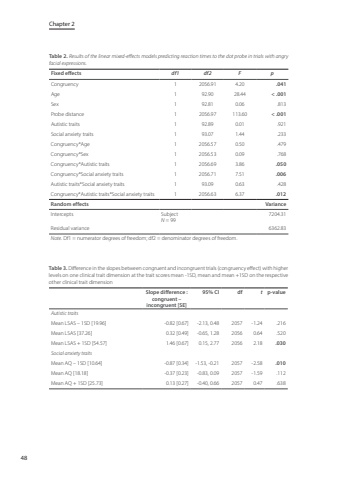
Chapter 248Table 2. Results of the linear mixed-effects models predicting reaction times to the dot probe in trials with angry facial expressions. Fixed effects df1 df2 F pCongruency 1 2056.91 4.20 .041Age 1 92.90 28.44 < .001Sex 1 92.81 0.06 .813Probe distance 1 2056.97 113.60 < .001Autistic traits 1 92.89 0.01 .921Social anxiety traits 1 93.07 1.44 .233Congruency*Age 1 2056.57 0.50 .479Congruency*Sex 1 2056.53 0.09 .768Congruency*Autistic traits 1 2056.69 3.86 .050Congruency*Social anxiety traits 1 2056.71 7.51 .006Autistic traits*Social anxiety traits 1 93.09 0.63 .428Congruency*Autistic traits*Social anxiety traits 1 2056.63 6.37 .012Random effects VarianceIntercepts SubjectN = 997204.31Residual variance 6362.83Note. Df1 = numerator degrees of freedom; df2 = denominator degrees of freedom.Table 3. Difference in the slopes between congruent and incongruent trials (congruency effect) with higher levels on one clinical trait dimension at the trait scores mean -1SD, mean and mean +1SD on the respective other clinical trait dimensionSlope difference%u00a0: congruent %u2013 incongruent [SE]95% CI df t p-valueAutistic traitsMean LSAS %u2013 1SD [19.96] -0.82 [0.67] -2.13, 0.48 2057 -1.24 .216Mean LSAS [37.26] 0.32 [0.49] -0.65, 1.28 2056 0.64 .520Mean LSAS + 1SD [54.57] 1.46 [0.67] 0.15, 2.77 2056 2.18 .030Social anxiety traitsMean AQ %u2013 1SD [10.64] -0.87 [0.34] -1.53, -0.21 2057 -2.58 .010Mean AQ [18.18] -0.37 [0.23] -0.83, 0.09 2057 -1.59 .112Mean AQ + 1SD [25.73] 0.13 [0.27] -0.40, 0.66 2057 0.47 .638
