
Page 129 - Demo
P. 129
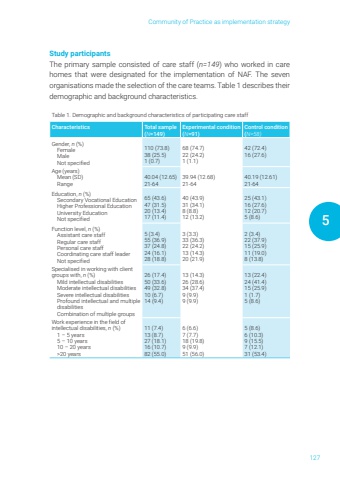
Community of Practice as implementation strategy1275Study participantsThe primary sample consisted of care staff (n=149) who worked in care homes that were designated for the implementation of NAF. The seven organisations made the selection of the care teams. Table 1 describes their demographic and background characteristics.Table 1. Demographic and background characteristics of participating care staffCharacteristics Total sample (N=149)Experimental condition (N=91)Control condition (N=58)Gender, n (%) Female Male Not specified110 (73.8)38 (25.5)1 (0.7)68 (74.7)22 (24.2)1 (1.1)42 (72.4)16 (27.6)Age (years) Mean (SD) Range 40.04 (12.65)21-6439.94 (12.68)21-6440.19 (12.61)21-64Education, n (%) Secondary Vocational Education Higher Professional Education University Education Not specified65 (43.6)47 (31.5)20 (13.4)17 (11.4)40 (43.9)31 (34.1)8 (8.8)12 (13.2)25 (43.1)16 (27.6)12 (20.7)5 (8.6)Function level, n (%) Assistant care staff Regular care staff Personal care staff Coordinating care staff leader Not specified5 (3.4)55 (36.9)37 (24.8)24 (16.1)28 (18.8)3 (3.3)33 (36.3)22 (24.2)13 (14.3)20 (21.9)2 (3.4)22 (37.9)15 (25.9)11 (19.0)8 (13.8)Specialised in working with client groups with, n (%) Mild intellectual disabilities Moderate intellectual disabilities Severe intellectual disabilities Profound intellectual and multiple disabilities Combination of multiple groups 26 (17.4)50 (33.6)49 (32.8)10 (6.7)14 (9.4)13 (14.3)26 (28.6)34 (37.4)9 (9.9)9 (9.9)13 (22.4)24 (41.4)15 (25.9)1 (1.7)5 (8.6)Work experience in the field of intellectual disabilities, n (%) 1 %u2013 5 years 5 %u2013 10 years 10 %u2013 20 years >20 years11 (7.4)13 (8.7)27 (18.1)16 (10.7)82 (55.0)6 (6.6)7 (7.7)18 (19.8)9 (9.9)51 (56.0)5 (8.6)6 (10.3)9 (15.5)7 (12.1)31 (53.4)
