
Page 157 - Coronary hemodynamics in acute myocardial infarction - Matthijs Bax
P. 157
Time course of coronary flow capacity in STEMI
(p=0.027), peak troponin T (p<0.001) and heart rate (p=0.049) across the different groups of CFC (Supplementary file 2).
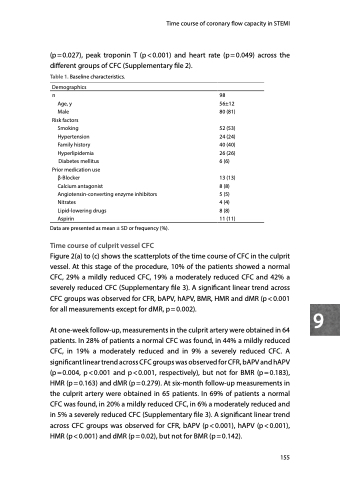
Table 1. Baseline characteristics.
Demographics n
Age, y
Male Risk factors
Smoking Hypertension Family history Hyperlipidemia
Diabetes mellitus Prior medication use
β-Blocker
Calcium antagonist Angiotensin-converting enzyme inhibitors Nitrates
Lipid-lowering drugs
Aspirin
Data are presented as mean ± SD or frequency (%).
Time course of culprit vessel CFC
98 56±12 80 (81)
52 (53) 24 (24) 40 (40) 26 (26) 6 (6)
13 (13) 8 (8)
5 (5)
4 (4)
8 (8) 11 (11)
Figure 2(a) to (c) shows the scatterplots of the time course of CFC in the culprit
vessel. At this stage of the procedure, 10% of the patients showed a normal
CFC, 29% a mildly reduced CFC, 19% a moderately reduced CFC and 42% a
severely reduced CFC (Supplementary file 3). A significant linear trend across
CFC groups was observed for CFR, bAPV, hAPV, BMR, HMR and dMR (p < 0.001
for all measurements except for dMR, p = 0.002). 9
At one-week follow-up, measurements in the culprit artery were obtained in 64 patients. In 28% of patients a normal CFC was found, in 44% a mildly reduced CFC, in 19% a moderately reduced and in 9% a severely reduced CFC. A significant linear trend across CFC groups was observed for CFR, bAPV and hAPV (p=0.004, p<0.001 and p<0.001, respectively), but not for BMR (p=0.183), HMR (p = 0.163) and dMR (p = 0.279). At six-month follow-up measurements in the culprit artery were obtained in 65 patients. In 69% of patients a normal CFC was found, in 20% a mildly reduced CFC, in 6% a moderately reduced and in 5% a severely reduced CFC (Supplementary file 3). A significant linear trend across CFC groups was observed for CFR, bAPV (p<0.001), hAPV (p<0.001), HMR (p < 0.001) and dMR (p = 0.02), but not for BMR (p = 0.142).
155
