
Page 158 - Coronary hemodynamics in acute myocardial infarction - Matthijs Bax
P. 158
Chapter 9
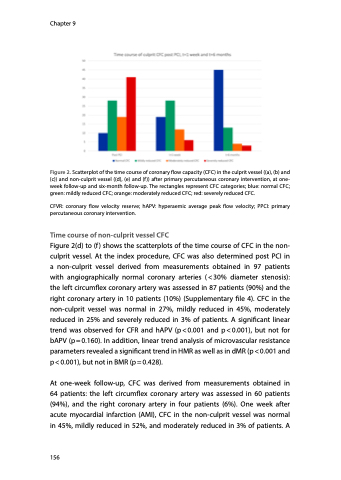
Figure 2. Scatterplot of the time course of coronary flow capacity (CFC) in the culprit vessel ((a), (b) and (c)) and non-culprit vessel ((d), (e) and (f)) after primary percutaneous coronary intervention, at one- week follow-up and six-month follow-up. The rectangles represent CFC categories; blue: normal CFC; green: mildly reduced CFC; orange: moderately reduced CFC; red: severely reduced CFC.
CFVR: coronary flow velocity reserve; hAPV: hyperaemic average peak flow velocity; PPCI: primary percutaneous coronary intervention.
Time course of non-culprit vessel CFC
Figure 2(d) to (f) shows the scatterplots of the time course of CFC in the non- culprit vessel. At the index procedure, CFC was also determined post PCI in a non-culprit vessel derived from measurements obtained in 97 patients with angiographically normal coronary arteries (<30% diameter stenosis): the left circumflex coronary artery was assessed in 87 patients (90%) and the right coronary artery in 10 patients (10%) (Supplementary file 4). CFC in the non-culprit vessel was normal in 27%, mildly reduced in 45%, moderately reduced in 25% and severely reduced in 3% of patients. A significant linear trend was observed for CFR and hAPV (p<0.001 and p<0.001), but not for bAPV (p=0.160). In addition, linear trend analysis of microvascular resistance parameters revealed a significant trend in HMR as well as in dMR (p < 0.001 and p < 0.001), but not in BMR (p = 0.428).
At one-week follow-up, CFC was derived from measurements obtained in 64 patients: the left circumflex coronary artery was assessed in 60 patients (94%), and the right coronary artery in four patients (6%). One week after acute myocardial infarction (AMI), CFC in the non-culprit vessel was normal in 45%, mildly reduced in 52%, and moderately reduced in 3% of patients. A
156
