
Page 155 - Coronary hemodynamics in acute myocardial infarction - Matthijs Bax
P. 155
Time course of coronary flow capacity in STEMI
PCI, coronary angiography suitable for quantitative coronary angiographic analysis was performed for offline analysis of TIMI flow and myocardial blush grade. Left ventricular function was evaluated by means of echocardiographic 16-segment wall motion score index performed immediately before primary PCI.
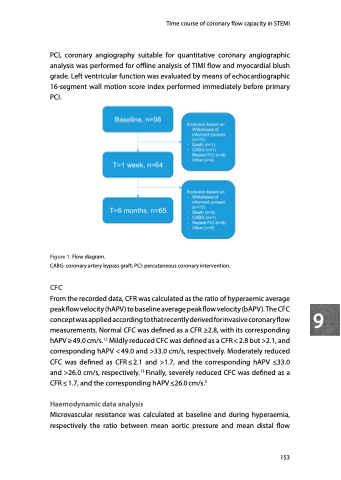
Figure 1. Flow diagram.
CABG: coronary artery bypass graft; PCI: percutaneous coronary intervention.
CFC
From the recorded data, CFR was calculated as the ratio of hyperaemic average
peak flow velocity (hAPV ) to baseline average peak flow velocity (bAPV ). The CFC 9 concept was applied according to that recently derived for invasive coronary flow measurements. Normal CFC was defined as a CFR ≥2.8, with its corresponding
hAPV ≥ 49.0 cm/s.12 Mildly reduced CFC was defined as a CFR < 2.8 but >2.1, and corresponding hAPV < 49.0 and >33.0 cm/s, respectively. Moderately reduced
CFC was defined as CFR≤2.1 and >1.7, and the corresponding hAPV ≤33.0
and >26.0 cm/s, respectively.13 Finally, severely reduced CFC was defined as a
CFR ≤ 1.7, and the corresponding hAPV ≤26.0 cm/s.5
Haemodynamic data analysis
Microvascular resistance was calculated at baseline and during hyperaemia, respectively the ratio between mean aortic pressure and mean distal flow
153
