
Page 104 - Demo
P. 104
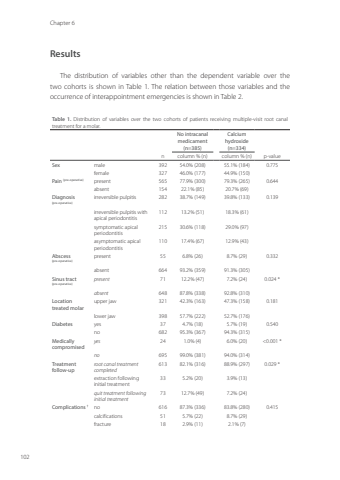
Chapter 6102Results The distribution of variables other than the dependent variable over the two cohorts is shown in Table 1. The relation between those variables and the occurrence of interappointment emergencies is shown in Table 2. Table 1. Distribution of variables over the two cohorts of patients receiving multiple-visit root canal treatment for a molar.No intracanal medicament (n=385)Calcium hydroxide (n=334)n column % (n) column % (n) p-valueSex male 392 54.0% (208) 55.1% (184) 0.775female 327 46.0% (177) 44.9% (150)Pain (pre-operative) present 565 77.9% (300) 79.3% (265) 0.644absent 154 22.1% (85) 20.7% (69)Diagnosis (pre-operative)irreversible pulpitis 282 38.7% (149) 39.8% (133) 0.139irreversible pulpitis with apical periodontitis112 13.2% (51) 18.3% (61)symptomatic apical periodontitis215 30.6% (118) 29.0% (97)asymptomatic apical periodontitis110 17.4% (67) 12.9% (43)Abscess(pre-operative)present 55 6.8% (26) 8.7% (29) 0.332absent 664 93.2% (359) 91.3% (305)Sinus tract (pre-operative)present 71 12.2% (47) 7.2% (24) 0.024 *absent 648 87.8% (338) 92.8% (310)Location treated molarupper jaw 321 42.3% (163) 47.3% (158) 0.181lower jaw 398 57.7% (222) 52.7% (176)Diabetes yes 37 4.7% (18) 5.7% (19) 0.540no 682 95.3% (367) 94.3% (315)Medically compromisedyes 24 1.0% (4) 6.0% (20) <0.001 *no 695 99.0% (381) 94.0% (314)Treatment follow-uproot canal treatment completed613 82.1% (316) 88.9% (297) 0.029 *extraction following initial treatment33 5.2% (20) 3.9% (13)quit treatment following initial treatment73 12.7% (49) 7.2% (24)Complications † no 616 87.3% (336) 83.8% (280) 0.415calcifications 51 5.7% (22) 8.7% (29)fracture 18 2.9% (11) 2.1% (7)Annemarie Baaij.indd 102 28-06-2023 12:26
