
Page 43 - Demo
P. 43
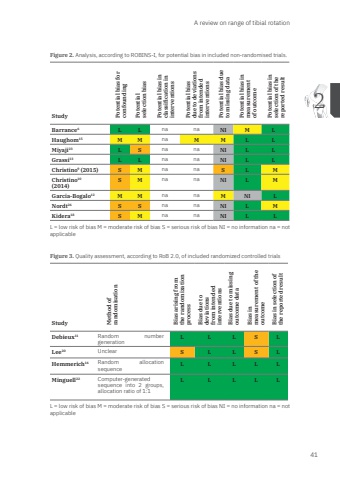
A review on range of tibial rotation412Table 5. study characteristics ACLR subjects evaluated using other evaluation methodsAuthor Design Population Groups Surgical technique Measuring MethodMeasurements Force appliedHemmerich16 RCT n=32 ControlSB reconstructionDB reconstruction*anatomic SB and DBhamstring tendonMRI 0° and 30° of flexionmanually mean 5.2NmNordt26 Retrospective n=21 ControlSB reconstructionBPTB CT 20° of flexion 5NmKidera18 Cross-sectional N = 10 ACL-deficient+ACL- reconstructed+DB, hamstrings 2D/3D CT dynamic squattingACL = anterior cruciate ligament, SB = Single Bundle, DB = Double Bundle, BPTB = Bone Patellar Tendon Bone, RCT = Randomised Controlled Trial, MRI = Magnetic Resonance Imaging, CT = Computed Tomography, * no data available on DB reconstruction group, + same subject pre- and postoperativeFigure 2. Analysis, according to ROBINS-I, for potential bias in included non-randomised trials. StudyPotential bias for confoundingPotential selection biasPotential bias in classification in interventionsPotential bias due to deviations from intended interventionsPotential bias due to missing dataPotential bias in measurementof outcome Potential bias in selection of the reported result Barrance6 L L na na NI M LHaughom15 M M na M M L LMiyaji23 L S na na NI L LGrassi13 L L na na NI L LChristino9 (2015) S M na na S L MChristino10(2014) S M na na NI L MGarcia-Bogalo12 M M na na M NI LNordt26 S S na na NI L MKidera18 S M na na NI L LL = low risk of bias M = moderate risk of bias S = serious risk of bias NI = no information na = not applicableFigure 3. Quality assessment, according to RoB 2.0, of included randomized controlled trialsStudyMethod of randomisationBias arising from the randomization processBias due to deviations from intended interventionsBias due to missing outcome dataBias in measurement of the outcomeBias in selection of the reported resultDebieux11 Random number generationL L L S LLee20 Unclear S L L S LHemmerich16 Random allocation sequenceL L L L LMinguell22 Computer-generated sequence into 2 groups, allocation ratio of 1:1L L L L LL = low risk of bias M = moderate risk of bias S = serious risk of bias NI = no information na = not applicableMark Zee.indd 41 03-01-2024 08:56
