
Page 124 - Demo
P. 124
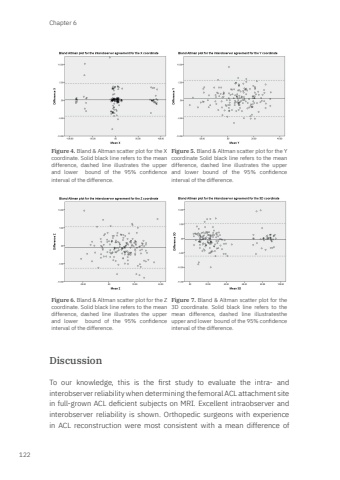
Chapter 6122Figure 4. Bland & Altman scatter plot for the X coordinate. Solid black line refers to the mean difference, dashed line illustrates the upper and lower bound of the 95% confidence interval of the difference.Figure 5. Bland & Altman scatter plot for the Y coordinate Solid black line refers to the mean difference, dashed line illustrates the upper and lower bound of the 95% confidence interval of the difference.Figure 6. Bland & Altman scatter plot for the Z coordinate. Solid black line refers to the mean difference, dashed line illustrates the upper and lower bound of the 95% confidence interval of the difference.Figure 7. Bland & Altman scatter plot for the 3D coordinate. Solid black line refers to the mean difference, dashed line illustratesthe upper and lower bound of the 95% confidence interval of the difference.Discussion To our knowledge, this is the first study to evaluate the intra- and interobserver reliability when determining the femoral ACL attachment site in full-grown ACL deficient subjects on MRI. Excellent intraobserver and interobserver reliability is shown. Orthopedic surgeons with experience in ACL reconstruction were most consistent with a mean difference of Mark Zee.indd 122 03-01-2024 08:56
