
Page 122 - Demo
P. 122
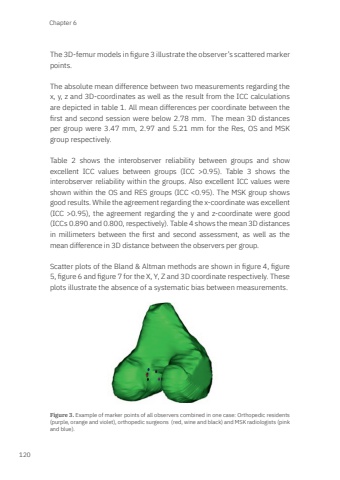
Chapter 6120The 3D-femur models in figure 3 illustrate the observer’s scattered marker points. The absolute mean difference between two measurements regarding the x, y, z and 3D-coordinates as well as the result from the ICC calculations are depicted in table 1. All mean differences per coordinate between the first and second session were below 2.78 mm. The mean 3D distances per group were 3.47 mm, 2.97 and 5.21 mm for the Res, OS and MSK group respectively.Table 2 shows the interobserver reliability between groups and show excellent ICC values between groups (ICC >0.95). Table 3 shows the interobserver reliability within the groups. Also excellent ICC values were shown within the OS and RES groups (ICC <0.95). The MSK group shows good results. While the agreement regarding the x-coordinate was excellent (ICC >0.95), the agreement regarding the y and z-coordinate were good (ICCs 0.890 and 0.800, respectively). Table 4 shows the mean 3D distances in millimeters between the first and second assessment, as well as the mean difference in 3D distance between the observers per group. Scatter plots of the Bland & Altman methods are shown in figure 4, figure 5, figure 6 and figure 7 for the X, Y, Z and 3D coordinate respectively. These plots illustrate the absence of a systematic bias between measurements.Figure 3. Example of marker points of all observers combined in one case: Orthopedic residents (purple, orange and violet), orthopedic surgeons (red, wine and black) and MSK radiologists (pink and blue).Mark Zee.indd 120 03-01-2024 08:56
