
Page 94 - Development of Functional Scaffolds for Bone Tissue Engineering Using 3D-Bioprinting of Cells and Biomaterials - Yasaman Zamani
P. 94
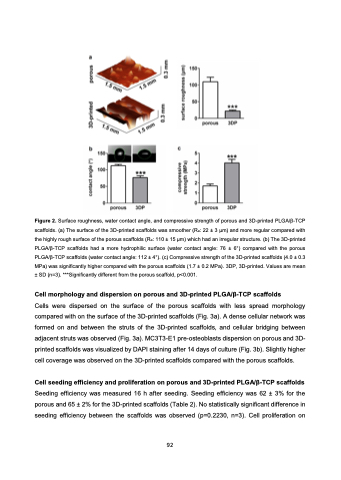
 Figure 2. Surface roughness, water contact angle, and compressive strength of porous and 3D-printed PLGA/β-TCP scaffolds. (a) The surface of the 3D-printed scaffolds was smoother (Ra: 22 ± 3 μm) and more regular compared with the highly rough surface of the porous scaffolds (Ra: 110 ± 15 μm) which had an irregular structure. (b) The 3D-printed PLGA/β-TCP scaffolds had a more hydrophilic surface (water contact angle: 76 ± 6°) compared with the porous PLGA/β-TCP scaffolds (water contact angle: 112 ± 4°). (c) Compressive strength of the 3D-printed scaffolds (4.0 ± 0.3 MPa) was significantly higher compared with the porous scaffolds (1.7 ± 0.2 MPa). 3DP, 3D-printed. Values are mean ± SD (n=3). ***Significantly different from the porous scaffold, p<0.001.
Cell morphology and dispersion on porous and 3D-printed PLGA/β-TCP scaffolds
Cells were dispersed on the surface of the porous scaffolds with less spread morphology compared with on the surface of the 3D-printed scaffolds (Fig. 3a). A dense cellular network was formed on and between the struts of the 3D-printed scaffolds, and cellular bridging between adjacent struts was observed (Fig. 3a). MC3T3-E1 pre-osteoblasts dispersion on porous and 3D- printed scaffolds was visualized by DAPI staining after 14 days of culture (Fig. 3b). Slightly higher cell coverage was observed on the 3D-printed scaffolds compared with the porous scaffolds.
Cell seeding efficiency and proliferation on porous and 3D-printed PLGA/β-TCP scaffolds
Seeding efficiency was measured 16 h after seeding. Seeding efficiency was 62 ± 3% for the porous and 65 ± 2% for the 3D-printed scaffolds (Table 2). No statistically significant difference in seeding efficiency between the scaffolds was observed (p=0.2230, n=3). Cell proliferation on
92
