
Page 93 - Development of Functional Scaffolds for Bone Tissue Engineering Using 3D-Bioprinting of Cells and Biomaterials - Yasaman Zamani
P. 93
(water contact angle: 112 ± 4°; p=0.0009, n=3; Fig. 2b). Compressive strength of the 3D-printed scaffolds (4.0 ± 0.3 MPa) was higher (p=0.0006, n=3) compared with the porous scaffolds (1.7 ± 0.2 MPa; Fig. 2c).
Table 1. Porosity and pore size of porous and 3D-printed PLGA/β-TCP scaffolds.
porosity (%)
porous 85 ± 5
3D-printed 39 ± 7
Values are mean ± SD (n=3).
pore size (μm)
408 ± 90 315 ± 17
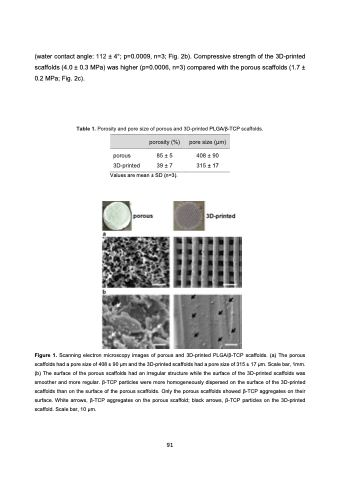
Figure 1. Scanning electron microscopy images of porous and 3D-printed PLGA/β-TCP scaffolds. (a) The porous scaffolds had a pore size of 408 ± 90 μm and the 3D-printed scaffolds had a pore size of 315 ± 17 μm. Scale bar, 1mm. (b) The surface of the porous scaffolds had an irregular structure while the surface of the 3D-printed scaffolds was smoother and more regular. β-TCP particles were more homogeneously dispersed on the surface of the 3D-printed scaffolds than on the surface of the porous scaffolds. Only the porous scaffolds showed β-TCP aggregates on their surface. White arrows, β-TCP aggregates on the porous scaffold; black arrows, β-TCP particles on the 3D-printed scaffold. Scale bar, 10 μm.
91
