
Page 115 - Demo
P. 115
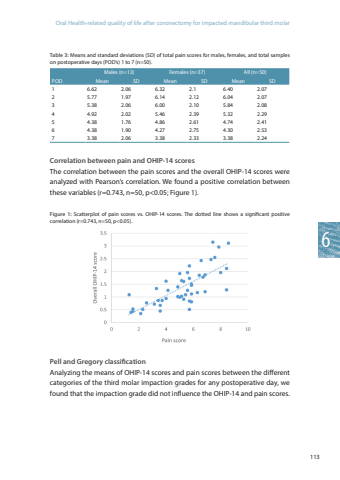
Oral Health-related quality of life after coronectomy for impacted mandibular third molar1136Table 3: Means and standard deviations (SD) of total pain scores for males, females, and total samples on postoperative days (POD’s) 1 to 7 (n=50).Males (n=13) Females (n=37) All (n=50)POD Mean SD Mean SD Mean SD1 6.62 2.06 6.32 2.1 6.40 2.072 5.77 1.97 6.14 2.12 6.04 2.073 5.38 2.06 6.00 2.10 5.84 2.084 4.92 2.02 5.46 2.39 5.32 2.295 4.38 1.76 4.86 2.61 4.74 2.416 4.38 1.90 4.27 2.75 4.30 2.537 3.38 2.06 3.38 2.33 3.38 2.24Correlation between pain and OHIP-14 scoresThe correlation between the pain scores and the overall OHIP-14 scores were analyzed with Pearson’s correlation. We found a positive correlation between these variables (r=0.743, n=50, p<0.05; Figure 1). Figure 1: Scatterplot of pain scores vs. OHIP-14 scores. The dotted line shows a significant positive correlation (r=0.743, n=50, p<0.05).Pell and Gregory classification Analyzing the means of OHIP-14 scores and pain scores between the different categories of the third molar impaction grades for any postoperative day, we found that the impaction grade did not influence the OHIP-14 and pain scores.
