
Page 114 - Demo
P. 114
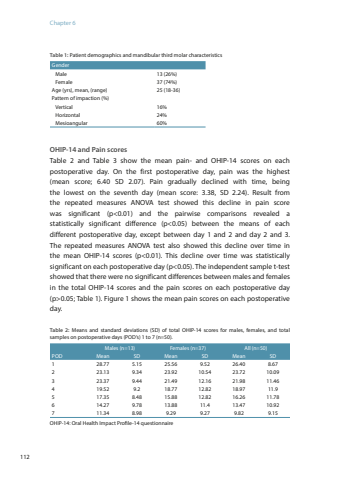
Chapter 6112Table 1: Patient demographics and mandibular third molar characteristics Gender Male 13 (26%) Female 37 (74%)Age (yrs), mean, (range) 25 (18-36)Pattern of impaction (%) Vertical 16% Horizontal 24% Mesioangular 60%OHIP-14 and Pain scores Table 2 and Table 3 show the mean pain- and OHIP-14 scores on each postoperative day. On the first postoperative day, pain was the highest (mean score; 6.40 SD 2.07). Pain gradually declined with time, being the lowest on the seventh day (mean score: 3.38, SD 2.24). Result from the repeated measures ANOVA test showed this decline in pain score was significant (p<0.01) and the pairwise comparisons revealed a statistically significant difference (p<0.05) between the means of each different postoperative day, except between day 1 and 2 and day 2 and 3.The repeated measures ANOVA test also showed this decline over time in the mean OHIP-14 scores (p<0.01). This decline over time was statistically significant on each postoperative day (p<0.05). The independent sample t-test showed that there were no significant differences between males and females in the total OHIP-14 scores and the pain scores on each postoperative day (p>0.05; Table 1). Figure 1 shows the mean pain scores on each postoperative day. Table 2: Means and standard deviations (SD) of total OHIP-14 scores for males, females, and total samples on postoperative days (POD’s) 1 to 7 (n=50).Males (n=13) Females (n=37) All (n=50)POD Mean SD Mean SD Mean SD1 28.77 5.15 25.56 9.52 26.40 8.672 23.13 9.34 23.92 10.54 23.72 10.093 23.37 9.44 21.49 12.16 21.98 11.464 19.52 9.2 18.77 12.82 18.97 11.95 17.35 8.48 15.88 12.82 16.26 11.786 14.27 9.78 13.88 11.4 13.47 10.927 11.34 8.98 9.29 9.27 9.82 9.15OHIP-14: Oral Health Impact Profile-14 questionnaire
