
Page 261 - Demo
P. 261
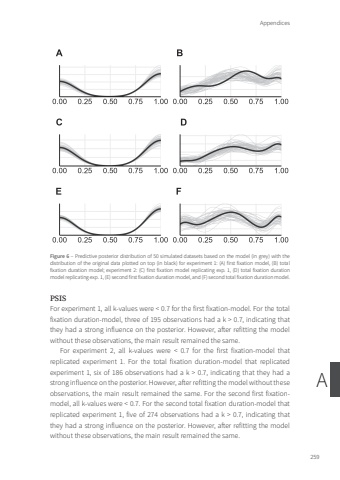
Appendices259AFigure 6 – Predictive posterior distribution of 50 simulated datasets based on the model (in grey) with the distribution of the original data plotted on top (in black) for experiment 1: (A) first fixation model, (B) total fixation duration model; experiment 2: (C) first fixation model replicating exp. 1, (D) total fixation duration model replicating exp. 1, (E) second first fixation duration model, and (F) second total fixation duration model.PSISFor experiment 1, all k-values were < 0.7 for the first fixation-model. For the total fixation duration-model, three of 195 observations had a k > 0.7, indicating that they had a strong influence on the posterior. However, after refitting the model without these observations, the main result remained the same.For experiment 2, all k-values were < 0.7 for the first fixation-model that replicated experiment 1. For the total fixation duration-model that replicated experiment 1, six of 186 observations had a k > 0.7, indicating that they had a strong influence on the posterior. However, after refitting the model without these observations, the main result remained the same. For the second first fixationmodel, all k-values were < 0.7. For the second total fixation duration-model that replicated experiment 1, five of 274 observations had a k > 0.7, indicating that they had a strong influence on the posterior. However, after refitting the model without these observations, the main result remained the same.Tom Roth.indd 259 08-01-2024 10:42
