
Page 258 - Demo
P. 258
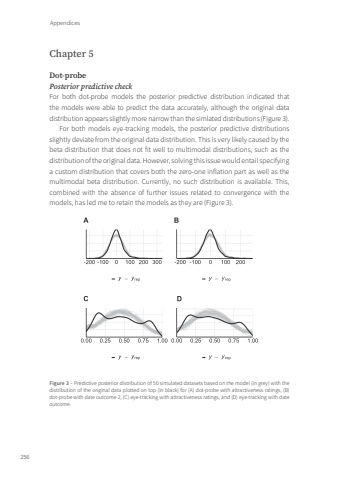
Appendices256Chapter 5Dot-probePosterior predictive checkFor both dot-probe models the posterior predictive distribution indicated that the models were able to predict the data accurately, although the original data distribution appears slightly more narrow than the simlated distributions (Figure 3).For both models eye-tracking models, the posterior predictive distributions slightly deviate from the original data distribution. This is very likely caused by the beta distribution that does not fit well to multimodal distributions, such as the distribution of the original data. However, solving this issue would entail specifying a custom distribution that covers both the zero-one inflation part as well as the multimodal beta distribution. Currently, no such distribution is available. This, combined with the absence of further issues related to convergence with the models, has led me to retain the models as they are (Figure 3).Figure 3 – Predictive posterior distribution of 50 simulated datasets based on the model (in grey) with the distribution of the original data plotted on top (in black) for (A) dot-probe with attractiveness ratings, (B) dot-probe with date outcome 2, (C) eye-tracking with attractiveness ratings, and (D) eye-tracking with date outcome.Tom Roth.indd 256 08-01-2024 10:42
