
Page 259 - Demo
P. 259
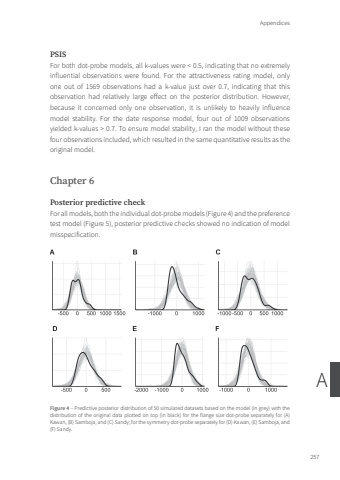
Appendices257APSISFor both dot-probe models, all k-values were < 0.5, indicating that no extremely influential observations were found. For the attractiveness rating model, only one out of 1569 observations had a k-value just over 0.7, indicating that this observation had relatively large effect on the posterior distribution. However, because it concerned only one observation, it is unlikely to heavily influence model stability. For the date response model, four out of 1009 observations yielded k-values > 0.7. To ensure model stability, I ran the model without these four observations included, which resulted in the same quantitative results as the original model.Chapter 6Posterior predictive checkFor all models, both the individual dot-probe models (Figure 4) and the preference test model (Figure 5), posterior predictive checks showed no indication of model misspecification.Figure 4 – Predictive posterior distribution of 50 simulated datasets based on the model (in grey) with the distribution of the original data plotted on top (in black) for the flange size dot-probe separately for (A) Kawan, (B) Samboja, and (C) Sandy; for the symmetry dot-probe separately for (D) Kawan, (E) Samboja, and (F) Sandy.Tom Roth.indd 257 08-01-2024 10:42
