
Page 238 - Demo
P. 238
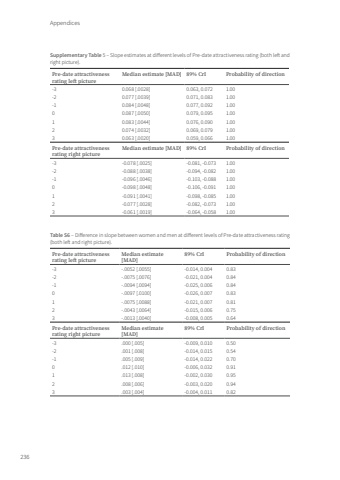
Appendices236Supplementary Table 5 – Slope estimates at different levels of Pre-date attractiveness rating (both left and right picture).Pre-date attractiveness rating left pictureMedian estimate [MAD] 89% CrI Probability of direction-3 0.068 [.0028] 0.063, 0.072 1.00-2 0.077 [.0039] 0.071, 0.083 1.00-1 0.084 [.0048] 0.077, 0.092 1.000 0.087 [.0050] 0.079, 0.095 1.001 0.083 [.0044] 0.076, 0.090 1.002 0.074 [.0032] 0.069, 0.079 1.003 0.063 [.0020] 0.059, 0.066 1.00Pre-date attractiveness rating right pictureMedian estimate [MAD] 89% CrI Probability of direction-3 -0.078 [.0025] -0.081, -0.073 1.00-2 -0.088 [.0038] -0.094, -0.082 1.00-1 -0.096 [.0046] -0.103, -0.088 1.000 -0.098 [.0048] -0.106, -0.091 1.001 -0.091 [.0041] -0.098, -0.085 1.002 -0.077 [.0028] -0.082, -0.073 1.003 -0.061 [.0019] -0.064, -0.058 1.00Table S6 – Difference in slope between women and men at different levels of Pre-date attractiveness rating (both left and right picture).Pre-date attractiveness rating left pictureMedian estimate [MAD]89% CrI Probability of direction-3 -.0052 [.0055] -0.014, 0.004 0.83-2 -.0075 [.0076] -0.021, 0.004 0.84-1 -.0094 [.0094] -0.025, 0.006 0.840 -.0097 [.0100] -0.026, 0.007 0.831 -.0075 [.0088] -0.021, 0.007 0.812 -.0043 [.0064] -0.015, 0.006 0.753 -.0013 [.0040] -0.008, 0.005 0.64Pre-date attractiveness rating right pictureMedian estimate [MAD]89% CrI Probability of direction-3 .000 [.005] -0.009, 0.010 0.50-2 .001 [.008] -0.014, 0.015 0.54-1 .005 [.009] -0.014, 0.022 0.700 .012 [.010] -0.006, 0.032 0.911 .013 [.008] -0.002, 0.030 0.952 .008 [.006] -0.003, 0.020 0.943 .003 [.004] -0.004, 0.011 0.82Tom Roth.indd 236 08-01-2024 10:42
