
Page 146 - Demo
P. 146
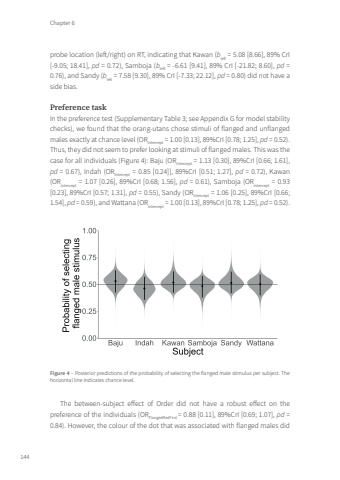
Chapter 6144probe location (left/right) on RT, indicating that Kawan (bleft = 5.08 [8.66], 89% CrI [-9.05; 18.41], pd = 0.72), Samboja (bleft = -6.61 [9.41], 89% CrI [-21.82; 8.60], pd = 0.76), and Sandy (bleft = 7.58 [9.30], 89% CrI [-7.33; 22.12], pd = 0.80) did not have a side bias. Preference taskIn the preference test (Supplementary Table 3; see Appendix G for model stability checks), we found that the orang-utans chose stimuli of flanged and unflanged males exactly at chance level (ORIntercept = 1.00 [0.13], 89%CrI [0.78; 1.25], pd = 0.52). Thus, they did not seem to prefer looking at stimuli of flanged males. This was the case for all individuals (Figure 4): Baju (ORIntercept = 1.13 [0.30], 89%CrI [0.66; 1.61], pd = 0.67), Indah (ORIntercept = 0.85 [0.24]], 89%CrI [0.51; 1.27], pd = 0.72), Kawan (ORIntercept = 1.07 [0.26], 89%CrI [0.68; 1.56], pd = 0.61), Samboja (ORIntercept = 0.93 [0.23], 89%CrI [0.57; 1.31], pd = 0.55), Sandy (ORIntercept = 1.06 [0.25], 89%CrI [0.66; 1.54], pd = 0.59), and Wattana (ORIntercept = 1.00 [0.13], 89%CrI [0.78; 1.25], pd = 0.52).Figure 4 – Posterior predictions of the probability of selecting the flanged male stimulus per subject. The horizontal line indicates chance level.The between-subject effect of Order did not have a robust effect on the preference of the individuals (ORFlangedRedFirst = 0.88 [0.11], 89%CrI [0.69; 1.07], pd = 0.84). However, the colour of the dot that was associated with flanged males did Tom Roth.indd 144 08-01-2024 10:41
