
Page 140 - Demo
P. 140
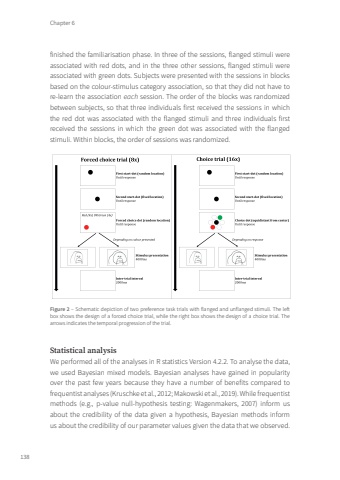
Chapter 6138finished the familiarisation phase. In three of the sessions, flanged stimuli were associated with red dots, and in the three other sessions, flanged stimuli were associated with green dots. Subjects were presented with the sessions in blocks based on the colour-stimulus category association, so that they did not have to re-learn the association each session. The order of the blocks was randomized between subjects, so that three individuals first received the sessions in which the red dot was associated with the flanged stimuli and three individuals first received the sessions in which the green dot was associated with the flanged stimuli. Within blocks, the order of sessions was randomized.Figure 2 – Schematic depiction of two preference task trials with flanged and unflanged stimuli. The left box shows the design of a forced choice trial, while the right box shows the design of a choice trial. The arrows indicates the temporal progression of the trial.Statistical analysisWe performed all of the analyses in R statistics Version 4.2.2. To analyse the data, we used Bayesian mixed models. Bayesian analyses have gained in popularity over the past few years because they have a number of benefits compared to frequentist analyses (Kruschke et al., 2012; Makowski et al., 2019). While frequentist methods (e.g., p-value null-hypothesis testing: Wagenmakers, 2007) inform us about the credibility of the data given a hypothesis, Bayesian methods inform us about the credibility of our parameter values given the data that we observed. Tom Roth.indd 138 08-01-2024 10:41
