
Page 158 - Assessing right ventricular function and the pulmonary circulation in pulmonary hypertension Onno Anthonius Spruijt
P. 158
9
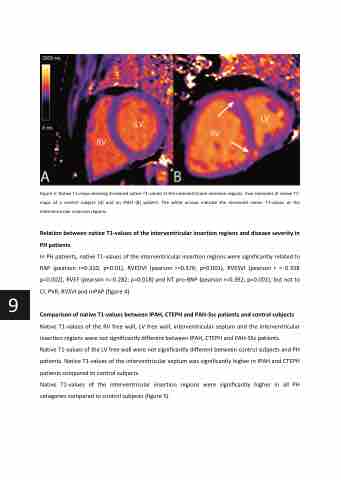
Figure 3: Native T1-maps showing increased native T1-values at the interventricular insertion regions. Two examples of native T1- maps of a control subject (A) and an IPAH (B) patient. The white arrows indicate the increased native T1-values at the interventricular insertion regions.
Relation between native T1-values of the interventricular insertion regions and disease severity in PH patients
In PH patients, native T1-values of the interventricular insertion regions were significantly related to RAP (pearson r=0.310; p=0.01), RVEDVI (pearson r=0.376; p=0.001), RVESVI (pearson r = 0.358 p=0.002), RVEF (pearson r=-0.282; p=0.018) and NT pro-BNP (pearson r=0.392; p=0.001), but not to CI, PVR, RVSVI and mPAP (figure 4).
Comparison of native T1-values between IPAH, CTEPH and PAH-Ssc patients and control subjects
Native T1-values of the RV free wall, LV free wall, interventricular septum and the interventricular insertion regions were not significantly different between IPAH, CTEPH and PAH-SSc patients.
Native T1-values of the LV free wall were not significantly different between control subjects and PH patients. Native T1-values of the interventricular septum was significantly higher in IPAH and CTEPH patients compared to control subjects.
Native T1-values of the interventricular insertion regions were significantly higher in all PH categories compared to control subjects (figure 5).
