
Page 98 - Risk quantification and modification in older patients with colorectal cancer
P. 98
Chapter 5
96
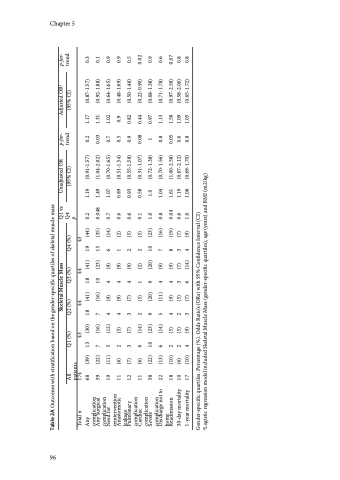
Table 2A Outcomes with stratification based on the gender-specific quartiles of skeletal muscle mass
Total n
Any 68
(39)
13 (30)
18 (41) 18 (41)
19 (44)
0.2
1.19 (0.91-1.57) 0.2 1.49 (1.04-2.02) 0.03 1.07 (0.70-1.65) 0.7 0.89 (0.51-1.54) 0.5 0.93 (0.55-1.58) 0.9 0.58 (0.31-1.07) 0.08
1.17 (0.87-1.57) 0.3
complication
Any Surgical 39
(22)
7 (16)
7 (16) 10 (23)
15 (35)
0.048
1.31 (0.92-1.88) 0.1
complication
Need for 19
(11)
5 (12)
4 (9) 4 (9)
6 (14)
0.7
1.02 (0.64-1.65) 0.9
reintervention Anastomotic 11
(6)
2 (5)
4 (9) 4 (9)
1 (2)
0.6
0.9 (0.48-1.69) 0.9
leakage
Pulmonary 12
(7)
3 (7)
3 (7) 4 (9)
2 (5)
0.6
0.82 (0.50-1.48) 0.5
complication
Cardiac 11
(6)
6 (14)
2 (5) 1 (2)
2 (5)
0.1
0.44 (0.22-0.90) 0.02
complication
Severe 38
(22)
10 (23)
9 (20) 9 (20)
10 (23)
1.0
1.0 (0.72-1.38) 1 1.04 (0.70-1.56) 0.8
0.97 (0.68-1.38) 0.9
complication Discharge not to 22
(13)
6 (14)
5 (11) 4 (9)
7 (16)
0.8
1.13 (0.71-1.78) 0.6
home
Readmission 18
(10) (6) (10)
2 (5) 2 (5) 4 (9)
4 (9) 4 (9) 2 (5) 3 (7) 3 (7) 6 (14)
8 (19) 3 (7) 4 (9)
0.04 0.6 1.0
1.61 (1.00-2.58) 0.05 1.19 (0.67-2.12) 0.6 1.08 (0.69-1.70) 0.8
1.58 (0.97-2.58) 0.07 1.09 (0.58-2.06) 0.8 1.05 (0.65-1.72) 0.8
30-day mortality 10 1-year mortality 17
All
Q2 (%) Q3 (%)
Q4 (%)
patients 174
Skeletal Muscle Mass
Q1 vs Q4
p
Unadjusted OR p-for- (95% CI) trend
Adjusted ORa p-for- (95% CI) trend
Q1 (%)
43 44 44 43
Gender-specific quartiles. Percentage (%). Odds Ratio’s (ORs) with 95% Confidence Interval (CI)
aLogistic regression model included Skeletal Muscle Mass (gender-specific quartiles), age (years) and BMI (m2/kg)
