
Page 97 - Risk quantification and modification in older patients with colorectal cancer
P. 97
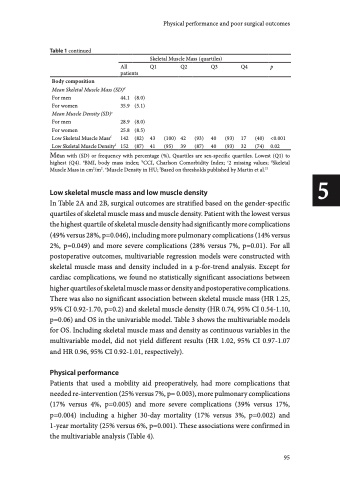
                                Table 1 continued
Body composition
Mean Skeletal Muscle Mass (SD)d
For men 44.1 For women 35.9 Mean Muscle Density (SD)e
For men 28.9 For women 25.8 Low Skeletal Muscle Massf 142 Low Skeletal Muscle Densityf 152
Physical performance and poor surgical outcomes
  Skeletal Muscle Mass (quartiles)
All Q1 Q2 Q3 Q4 p patients
   (8.0) (5.1)
(8.0)
(8.5)
(82) 43 (100) 42 (93) 40 (93) 17 (40) <0.001 (87) 41 (95) 39 (87) 40 (93) 32 (74) 0.02
 Mean with (SD) or frequency with percentage (%), Quartiles are sex-specific quartiles. Lowest (Q1) to highest (Q4). aBMI, body mass index; bCCI, Charlson Comorbidity Index; c2 missing values; dSkeletal Muscle Mass in cm2/m2. eMuscle Density in HU; fBased on thresholds published by Martin et al.21
Low skeletal muscle mass and low muscle density
In Table 2A and 2B, surgical outcomes are stratified based on the gender-specific quartiles of skeletal muscle mass and muscle density. Patient with the lowest versus the highest quartile of skeletal muscle density had significantly more complications (49% versus 28%, p=0.046), including more pulmonary complications (14% versus 2%, p=0.049) and more severe complications (28% versus 7%, p=0.01). For all postoperative outcomes, multivariable regression models were constructed with skeletal muscle mass and density included in a p-for-trend analysis. Except for cardiac complications, we found no statistically significant associations between higher quartiles of skeletal muscle mass or density and postoperative complications. There was also no significant association between skeletal muscle mass (HR 1.25, 95% CI 0.92-1.70, p=0.2) and skeletal muscle density (HR 0.74, 95% CI 0.54-1.10, p=0.06) and OS in the univariable model. Table 3 shows the multivariable models for OS. Including skeletal muscle mass and density as continuous variables in the multivariable model, did not yield different results (HR 1.02, 95% CI 0.97-1.07 and HR 0.96, 95% CI 0.92-1.01, respectively).
Physical performance
Patients that used a mobility aid preoperatively, had more complications that needed re-intervention (25% versus 7%, p= 0.003), more pulmonary complications (17% versus 4%, p=0.005) and more severe complications (39% versus 17%, p=0.004) including a higher 30-day mortality (17% versus 3%, p=0.002) and 1-year mortality (25% versus 6%, p=0.001). These associations were confirmed in the multivariable analysis (Table 4).
95
5
