
Page 100 - Risk quantification and modification in older patients with colorectal cancer
P. 100
Chapter 5
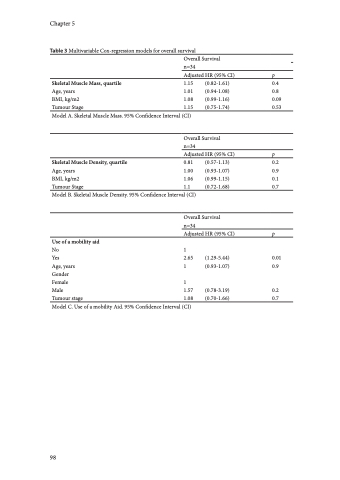
Table 3 Multivariable Cox-regression models for overall survival
Overall Survival
Skeletal Muscle Mass, quartile
n=34
Adjusted HR (95% CI) p 1.15 (0.82-1.61) 0.4 1.01 (0.94-1.08) 0.8 1.08 (0.99-1.16) 0.09 1.15 (0.75-1.74) 0.53
Age, years
BMI, kg/m2
Tumour Stage
Model A. Skeletal Muscle Mass. 95% Confidence Interval (CI)
Skeletal Muscle Density, quartile
Overall Survival
n=34
Adjusted HR (95% CI) p 0.81 (0.57-1.13) 0.2 1.00 (0.93-1.07) 0.9 1.06 (0.99-1.15) 0.1 1.1 (0.72-1.68) 0.7
Age, years
BMI, kg/m2
Tumour Stage
Model B. Skeletal Muscle Density. 95% Confidence Interval (CI)
Overall Survival
n=34
Adjusted HR (95% CI) p
Use of a mobility aid
No 1
Yes
Age, years
Gender
Female 1
Male
Tumour stage
Model C. Use of a mobility Aid. 95% Confidence Interval (CI)
2.65 (1.29-5.44) 0.01 1 (0.93-1.07) 0.9
1.57 (0.78-3.19) 0.2 1.08 (0.70-1.66) 0.7
98
